
AUD/USD Forex Technical Analysis – Decision Time for Aussie Bulls on Test of .7123 to .7055
The Australian Dollar is under pressure early Wednesday, falling to its lowest level since August 12, after the Reserve Bank of Australia (RBA) said it is assessing policy options. The news is being perceived as dovish.
According to Deputy Governor Guy Debelle, the RBA is assessing various monetary policy options including currency market intervention and negative rates to meet its inflation and employment goals.
At 02:11 GMT, the AUD/USD is trading .7135, down 0.0033 or -0.47%.
On Tuesday, Debelle said the board was assessing other policy options “given the outlook for inflation and employment is not consistent” with the Bank’s objectives over the period ahead.
One option is buying government bonds with maturities beyond three years. A second potential tool is foreign exchange intervention and a third option would be to lower the cash rate without taking it into negative territory. The final option was negative rates, though Debelle said the empirical evidence on its success was mixed.
Daily Swing Chart Technical Analysis
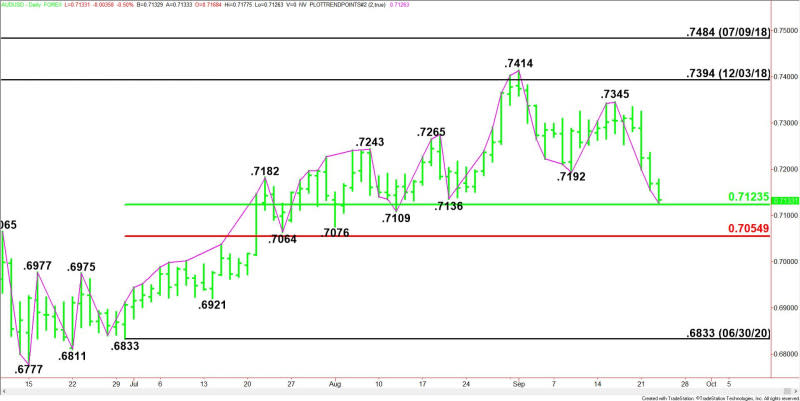
The main trend is down according to the daily swing chart. The main trend changed to down on Monday when sellers took out the previous main bottom at .7192. A trade through .7345 will change the main trend to up.
The main range is .6833 to .7414. Its retracement zone at .7123 to .7055 is the next downside target. Trader reaction to this zone could determine the longer-term direction of the AUD/USD. Watch for a possible technical bounce on the first test of this area.
Short-Term Outlook
The early price action on Wednesday suggests the direction of the AUD/USD the rest of the session is likely to be determined by trader reaction to the main 50% level at .7123.
Bearish Scenario
A sustained move under .7123 will indicate the presence of sellers. This could trigger a further break into the August 12 main bottom at .7109. Taking out this level could trigger an even further decline into a Fibonacci level at .7055.
Bullish Scenario
Holding above .7123 will signal the return of buyers. If this move is able to create enough upside momentum then we could see a 50% to 61.8% retracement of the break from the .7345 main top.
For a look at all of today’s economic events, check out our economic calendar.
This article was originally posted on FX Empire

