
AUD/USD Forex Technical Analysis – Traders Facing Big Decision on Test of .7192
The Australian Dollar is edging higher early Tuesday following the release of a private business confidence report. Improving risk sentiment is underpinning prices as global equity markets continued to inch higher. However, gains are likely being capped by steadily rising U.S. Treasury yields.
At 04:42 GMT, the AUD/USD is trading .7182, up 0.0033 or +0.46%.
On Tuesday, the National Australia Bank (NAB) warned ongoing outbreaks of COVID-19 will further dent business conditions, with its latest monthly survey revealing confidence in the economy has further deteriorated.
Daily Swing Chart Technical Analysis
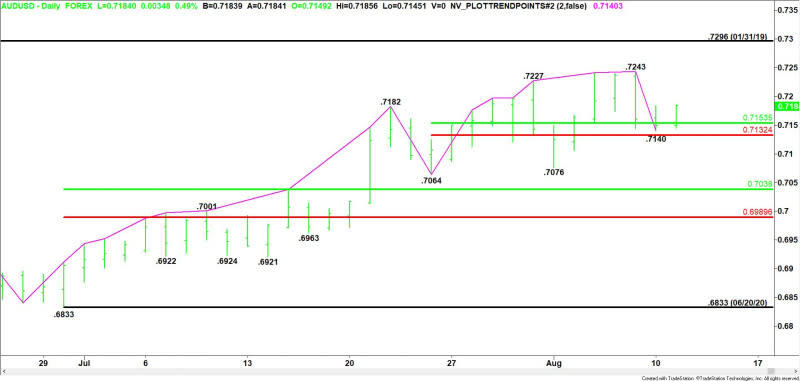
The main trend is up according to the daily swing chart. A trade through .7243 will signal a resumption of the uptrend. The main trend will change to down on a move through the last main bottom at .7064.
The minor trend is also up. A trade through .7140 will change the minor trend to down. This will also shift momentum to the downside.
The short-term range is .7064 to .7243. Its retracement zone at .7153 to .7132 is support. This zone stopped the selling at .7140 on Monday.
The main range is .6833 to .7243. If the main trend changes to down, then look for the selling to extend into the retracement zone at .7038 to .6990.
Daily Swing Chart Technical Forecast
Based on the early price action and the current price at .7182, the direction of the AUD/USD on Tuesday is likely to be determined by trader reaction to the short-term 50% level at .7153.
Bullish Scenario
A sustained move over .7153 will indicate the presence of buyers. The first potential upside target is 50% of the break from .7243 to .7140. This price is .7192. This is an important level because buyers are going to try to drive the AUD/USD through this it, while aggressive counter-trend sellers are going to try to form a potentially bearish secondary lower top.
If overtaking .7192 can create enough upside momentum then look for a possible near-term test of the main top at .7243. Taking out this level could trigger an acceleration into the January 31, 2019 main top at .7296.
Bearish Scenario
A sustained move under .7153 will signal the return of sellers. This is followed by the minor bottom at .7140 and the short-term Fibonacci level at .7132. The latter is a potential trigger point for an acceleration to the downside with another minor bottom at .7076 the next target. This is followed by the main bottom at .7064.
For a look at all of today’s economic events, check out our economic calendar.
This article was originally posted on FX Empire

