
AUD/USD Forex Technical Analysis – Low-Volume Price Action Suggests Investor Indecision, Impending Volatility
The Australian Dollar is edging higher on Tuesday in a lackluster trade. The currency is trading inside yesterday’s range, which suggests investor indecision. Traders are not paying too much attention to economic news with most keeping an eye on any movement in the United States toward a fiscal stimulus package and the potential impact of rising coronavirus cases on the global economic recovery.
At 08:43 GMT, the AUD/USD is trading .7130, up 0.0007 or +0.10%.
Essentially, a slight rise in demand for risky assets is helping to underpin the Aussie. Traders are also watching the polls as we approach the November 3 U.S. presidential election day.
The Reserve Bank of Australia (RBA) meets that same day. It is expected to trim its benchmark rate from 0.25 percent to 0.10 percent, and probably announce the start of more aggressive bond-buying in an effort to revive the economy with historically low interest rates.
Daily Swing Chart Technical Analysis
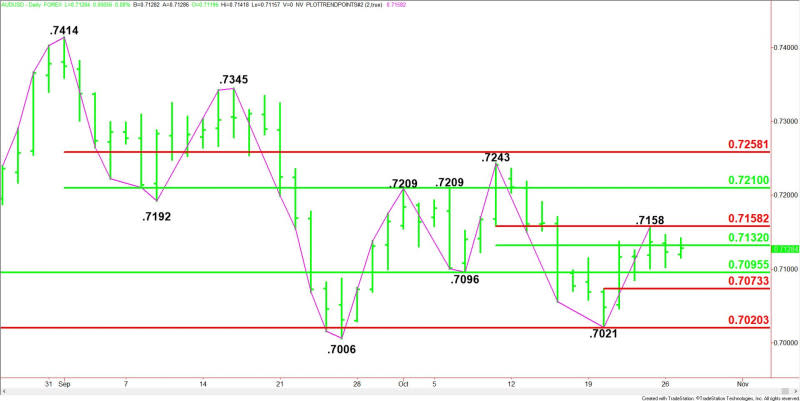
The main trend is down according to the daily swing chart. A trade through .7243 will change the main trend to up. A move through .7021 will signal a resumption of the downtrend.
The main support is a long-term retracement zone at .7095 to .7020. It stopped the selling recently at .7021. Inside this zone is a minor support area at .7090 to .7073.
The short-term range is .7243 to .7021. Its retracement zone at .7132 to .7158 is resistance. This zone stopped the buying at .7158 on Friday.
Daily Swing Chart Technical Forecast
Given the early price action, the direction of the AUD/USD on Tuesday is likely to be determined by trader reaction to the minor 50% level at .7132.
Bearish Scenario
A sustained move under .7132 will indicate the presence of sellers. This could trigger a break into a 50% level at .7095, followed by a minor support range at .7090 to .7073.
Bullish Scenario
A sustained move over .7132 will signal the presence of buyers. The first upside target is a resistance cluster at .7158. This is also a potential trigger point for an acceleration to the upside with .7210 the next likely upside target.
Side Notes
Keep in mind that we’re still in a headline driven market so expect heightened volatility especially since volume is low.
For a look at all of today’s economic events, check out our economic calendar.
This article was originally posted on FX Empire
More From FXEMPIRE:
AUD/USD Price Forecast – Australian Dollar Continues Sideways Momentum
Natural Gas Price Fundamental Daily Forecast – Hedge Funds Still Holding Massively Bullish Positions
AUD/USD Daily Forecast – Another Test Of Resistance At 0.7130
Price of Gold Fundamental Daily Forecast – Stimulus Stalemate Generating Rangebound Trade

