
How Does Sanoma Oyj's (HEL:SAA1V) P/E Compare To Its Industry, After The Share Price Drop?

To the annoyance of some shareholders, Sanoma Oyj (HEL:SAA1V) shares are down a considerable 30% in the last month. The recent drop has obliterated the annual return, with the share price now down 13% over that longer period.
Assuming nothing else has changed, a lower share price makes a stock more attractive to potential buyers. While the market sentiment towards a stock is very changeable, in the long run, the share price will tend to move in the same direction as earnings per share. The implication here is that long term investors have an opportunity when expectations of a company are too low. Perhaps the simplest way to get a read on investors' expectations of a business is to look at its Price to Earnings Ratio (PE Ratio). A high P/E implies that investors have high expectations of what a company can achieve compared to a company with a low P/E ratio.
View our latest analysis for Sanoma Oyj
Does Sanoma Oyj Have A Relatively High Or Low P/E For Its Industry?
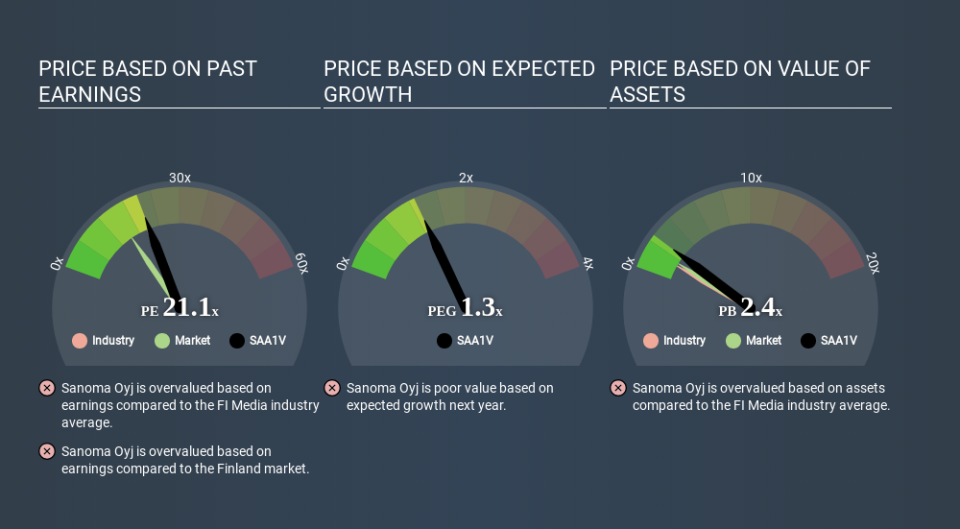
Sanoma Oyj has a P/E ratio of 21.13. The image below shows that Sanoma Oyj has a P/E ratio that is roughly in line with the media industry average (20.4).
Sanoma Oyj's P/E tells us that market participants think its prospects are roughly in line with its industry. So if Sanoma Oyj actually outperforms its peers going forward, that should be a positive for the share price. Checking factors such as director buying and selling. could help you form your own view on if that will happen.
How Growth Rates Impact P/E Ratios
When earnings fall, the 'E' decreases, over time. That means even if the current P/E is low, it will increase over time if the share price stays flat. Then, a higher P/E might scare off shareholders, pushing the share price down.
Sanoma Oyj saw earnings per share decrease by 14% last year. But EPS is up 3.1% over the last 5 years. And it has shrunk its earnings per share by 18% per year over the last three years. This growth rate might warrant a low P/E ratio.
A Limitation: P/E Ratios Ignore Debt and Cash In The Bank
Don't forget that the P/E ratio considers market capitalization. In other words, it does not consider any debt or cash that the company may have on the balance sheet. The exact same company would hypothetically deserve a higher P/E ratio if it had a strong balance sheet, than if it had a weak one with lots of debt, because a cashed up company can spend on growth.
While growth expenditure doesn't always pay off, the point is that it is a good option to have; but one that the P/E ratio ignores.
Is Debt Impacting Sanoma Oyj's P/E?
Sanoma Oyj has net debt equal to 47% of its market cap. While it's worth keeping this in mind, it isn't a worry.
The Bottom Line On Sanoma Oyj's P/E Ratio
Sanoma Oyj has a P/E of 21.1. That's higher than the average in its market, which is 15.7. With modest debt but no EPS growth in the last year, it's fair to say the P/E implies some optimism about future earnings, from the market. Given Sanoma Oyj's P/E ratio has declined from 30.3 to 21.1 in the last month, we know for sure that the market is significantly less confident about the business today, than it was back then. For those who prefer to invest with the flow of momentum, that might be a bad sign, but for a contrarian, it may signal opportunity.
Investors have an opportunity when market expectations about a stock are wrong. If the reality for a company is better than it expects, you can make money by buying and holding for the long term. So this free report on the analyst consensus forecasts could help you make a master move on this stock.
You might be able to find a better buy than Sanoma Oyj. If you want a selection of possible winners, check out this free list of interesting companies that trade on a P/E below 20 (but have proven they can grow earnings).
If you spot an error that warrants correction, please contact the editor at editorial-team@simplywallst.com. This article by Simply Wall St is general in nature. It does not constitute a recommendation to buy or sell any stock, and does not take account of your objectives, or your financial situation. Simply Wall St has no position in the stocks mentioned.
We aim to bring you long-term focused research analysis driven by fundamental data. Note that our analysis may not factor in the latest price-sensitive company announcements or qualitative material. Thank you for reading.

