
Does Summerset Group Holdings Limited's (NZSE:SUM) P/E Ratio Signal A Buying Opportunity?

This article is for investors who would like to improve their understanding of price to earnings ratios (P/E ratios). We'll look at Summerset Group Holdings Limited's (NZSE:SUM) P/E ratio and reflect on what it tells us about the company's share price. Summerset Group Holdings has a price to earnings ratio of 5.84, based on the last twelve months. That means that at current prices, buyers pay NZ$5.84 for every NZ$1 in trailing yearly profits.
View our latest analysis for Summerset Group Holdings
How Do I Calculate A Price To Earnings Ratio?
The formula for P/E is:
Price to Earnings Ratio = Share Price ÷ Earnings per Share (EPS)
Or for Summerset Group Holdings:
P/E of 5.84 = NZ$5.67 ÷ NZ$0.97 (Based on the year to December 2018.)
Is A High Price-to-Earnings Ratio Good?
The higher the P/E ratio, the higher the price tag of a business, relative to its trailing earnings. All else being equal, it's better to pay a low price -- but as Warren Buffett said, 'It's far better to buy a wonderful company at a fair price than a fair company at a wonderful price.'
Does Summerset Group Holdings Have A Relatively High Or Low P/E For Its Industry?
We can get an indication of market expectations by looking at the P/E ratio. If you look at the image below, you can see Summerset Group Holdings has a lower P/E than the average (10.6) in the healthcare industry classification.
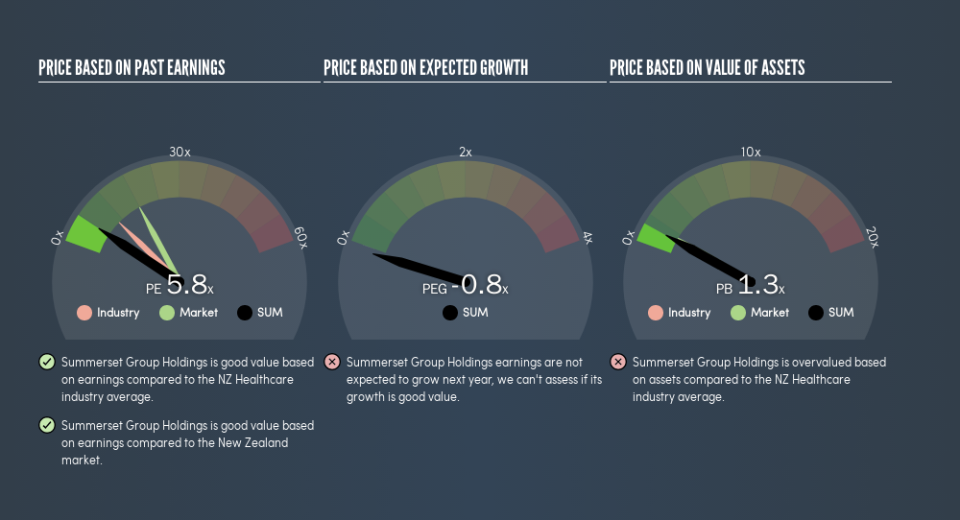
Summerset Group Holdings's P/E tells us that market participants think it will not fare as well as its peers in the same industry. Since the market seems unimpressed with Summerset Group Holdings, it's quite possible it could surprise on the upside. If you consider the stock interesting, further research is recommended. For example, I often monitor director buying and selling.
How Growth Rates Impact P/E Ratios
Earnings growth rates have a big influence on P/E ratios. That's because companies that grow earnings per share quickly will rapidly increase the 'E' in the equation. Therefore, even if you pay a high multiple of earnings now, that multiple will become lower in the future. So while a stock may look expensive based on past earnings, it could be cheap based on future earnings.
Summerset Group Holdings shrunk earnings per share by 12% over the last year. But EPS is up 43% over the last 5 years.
Remember: P/E Ratios Don't Consider The Balance Sheet
One drawback of using a P/E ratio is that it considers market capitalization, but not the balance sheet. So it won't reflect the advantage of cash, or disadvantage of debt. Theoretically, a business can improve its earnings (and produce a lower P/E in the future) by investing in growth. That means taking on debt (or spending its cash).
While growth expenditure doesn't always pay off, the point is that it is a good option to have; but one that the P/E ratio ignores.
Summerset Group Holdings's Balance Sheet
Summerset Group Holdings has net debt equal to 36% of its market cap. While it's worth keeping this in mind, it isn't a worry.
The Bottom Line On Summerset Group Holdings's P/E Ratio
Summerset Group Holdings has a P/E of 5.8. That's below the average in the NZ market, which is 17.9. With only modest debt, it's likely the lack of EPS growth at least partially explains the pessimism implied by the P/E ratio.
Investors have an opportunity when market expectations about a stock are wrong. As value investor Benjamin Graham famously said, 'In the short run, the market is a voting machine but in the long run, it is a weighing machine.' So this free visual report on analyst forecasts could hold the key to an excellent investment decision.
Of course you might be able to find a better stock than Summerset Group Holdings. So you may wish to see this free collection of other companies that have grown earnings strongly.
We aim to bring you long-term focused research analysis driven by fundamental data. Note that our analysis may not factor in the latest price-sensitive company announcements or qualitative material.
If you spot an error that warrants correction, please contact the editor at editorial-team@simplywallst.com. This article by Simply Wall St is general in nature. It does not constitute a recommendation to buy or sell any stock, and does not take account of your objectives, or your financial situation. Simply Wall St has no position in the stocks mentioned. Thank you for reading.

