
E-mini Dow Jones Industrial Average (YM) Futures Technical Analysis – Could See Test of 26714 into Close
December E-mini Dow Jones Industrial Average futures are edging lower shortly before the mid-session on Wednesday after giving back earlier gains. The blue chip average opened higher after component Nike hit a record high following a strong quarterly earnings report but gave back those gains after data showed domestic business activity nudged down in September.
At 15:38 GMT, December E-mini Dow Jones Industrial Average futures are trading 27113, down 30 or -0.11%.
Data from IHS Markit showed gains at factories were offset by a retreat at services industries in September, suggesting a loss of momentum in the economy as the third quarter draws to a close.
Daily Swing Chart Technical Analysis
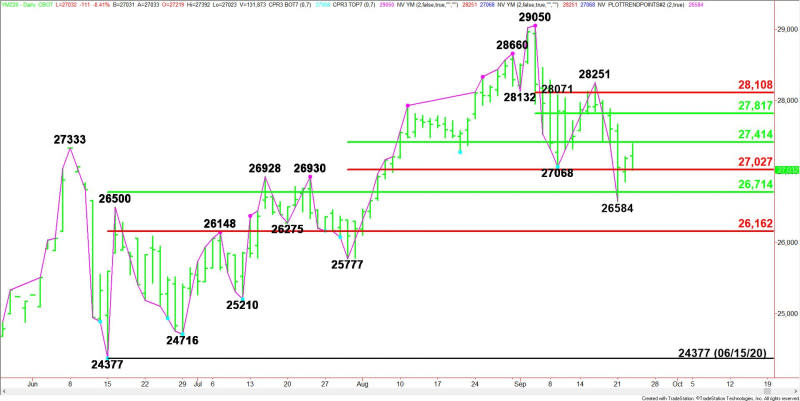
The main trend is down according to the daily swing chart. A trade through 26584 will signal a resumption of the downtrend. The main trend will change to up on a move through 28251.
The Dow is currently trading inside Monday’s wide range for a second session, suggesting investor indecision and impending volatility.
The main range is 24377 to 29050. Its retracement zone is acting like support, having stopped the selling at 26584 on Monday.
The intermediate range is 25777 to 29050. The Dow is currently trading inside its retracement zone at 27414 to 27027. Trader reaction to this zone is likely to determine the market’s direction today.
The short-term range is 29050 to 26584. Its retracement zone at 27817 to 28108 is resistance.
Short-Term Outlook
The early price action suggests the direction of the Dow into the close will be determined by trader reaction to 27027 and 27414.
Bearish Scenario
A sustained move under 27027 will indicate the presence of sellers. This could trigger a break into the main 50% level at 26714, followed closely by this week’s low at 26584.
Taking out 26584 could trigger an acceleration to the downside with the next target the main Fibonacci level at 26182.
Bullish Scenario
Overtaking the 50% level at 27414 will signal the presence of buyers. This could trigger an acceleration to the upside with the next target the short-term 50% level at 27817.
For a look at all of today’s economic events, check out our economic calendar.
This article was originally posted on FX Empire
