
E-mini Dow Jones Industrial Average (YM) Futures Technical Analysis – Major Downside Target 28824 – 28654
March E-mini Dow Jones Industrial Average futures are plummeting at the mid-session on Thursday. Aggressive selling pressure has driven the cash market more than 300 points lower. Traders said it was a combination of profit-taking and worries over the financial impact of the coronavirus on the economy driving the blue chip average lower.
At 16:41 GMT, March E-mini Dow Jones Industrial Average futures are trading 29043, down 294 or -1.00%.
The early break from a record high was fueled by a high-ranking Federal Reserve official who dampened market expectations for easier monetary policy from the U.S. central bank.
Daily Technical Analysis
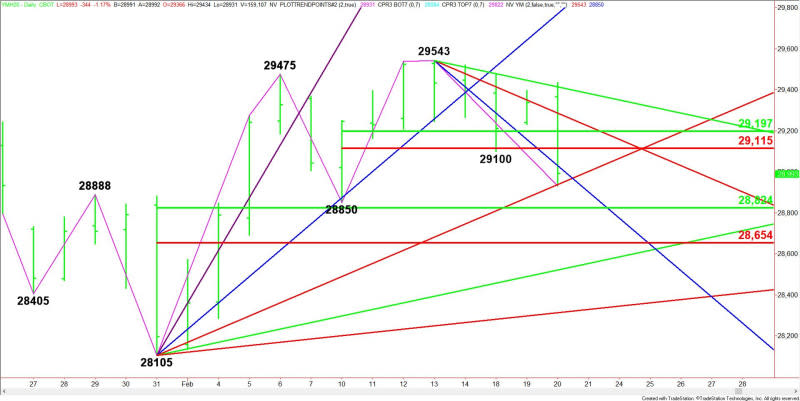
The main trend is up according to the daily swing chart, however, momentum has shifted to the downside.
The main trend will change to down on a trade through 28850, while a move through 29543 will signal a resumption of the uptrend.
The minor trend is down. It turned down when 29100 was taken out. This shifted momentum to the downside.
The short-term range is 28850 to 29543. Its retracement zone at 29115 to 29197 is new resistance.
The main range is 28105 to 29543. Its retracement zone at 28824 to 28654 is the next major downside target, value-seeking buyers could come in on a test of this area.
Daily Technical Forecast
Based on the early price action and the current price at 29043, the direction of the March E-mini Dow Jones Industrial Average the rest of the session on Thursday is likely to be determined by trader reaction to a pair of Gann angles at 28937 and 29031.
Bearish Scenario
A sustained move under 28937 will indicate the presence of sellers. This angle was tested earlier in the session and held as support. If it fails then look for the selling to extend into the main bottom at 28850. Taking this out will change the main trend to down. This could trigger a further break into the main 50% level at 28824. Watch for a technical bounce on the first test of this level.
If 28824 fails as support then look for the selling to extend into the main Fibonacci level at 28654.
Bullish Scenario
A sustained move over the downtrending Gann angle at 29031 will indicate the presence of buyers. This could trigger a rally back to 29115 to 29197, followed by a pair of downtrending Gann angles at 29287 and 29031.
This article was originally posted on FX Empire
More From FXEMPIRE:
Crude Oil Price Update – Breakout Over $54.20 Could Trigger Surge into $55.31; EIA Report on Tap
Gold Price Forecast – Gold Markets Continue to Show Strength
Crude Oil Price Forecast – Crude Oil Markets Continue to Show Recovery
GBP/USD Price Forecast – British Pound Continues To Struggle Against Greenback

