
Is Gain Plus Holdings Limited's (HKG:9900) High P/E Ratio A Problem For Investors?

Today, we'll introduce the concept of the P/E ratio for those who are learning about investing. We'll show how you can use Gain Plus Holdings Limited's (HKG:9900) P/E ratio to inform your assessment of the investment opportunity. Based on the last twelve months, Gain Plus Holdings's P/E ratio is 10.09. That is equivalent to an earnings yield of about 9.9%.
Check out our latest analysis for Gain Plus Holdings
How Do I Calculate A Price To Earnings Ratio?
The formula for price to earnings is:
Price to Earnings Ratio = Price per Share ÷ Earnings per Share (EPS)
Or for Gain Plus Holdings:
P/E of 10.09 = HK$1.000 ÷ HK$0.099 (Based on the trailing twelve months to September 2019.)
(Note: the above calculation results may not be precise due to rounding.)
Is A High Price-to-Earnings Ratio Good?
A higher P/E ratio means that buyers have to pay a higher price for each HK$1 the company has earned over the last year. That isn't necessarily good or bad, but a high P/E implies relatively high expectations of what a company can achieve in the future.
How Does Gain Plus Holdings's P/E Ratio Compare To Its Peers?
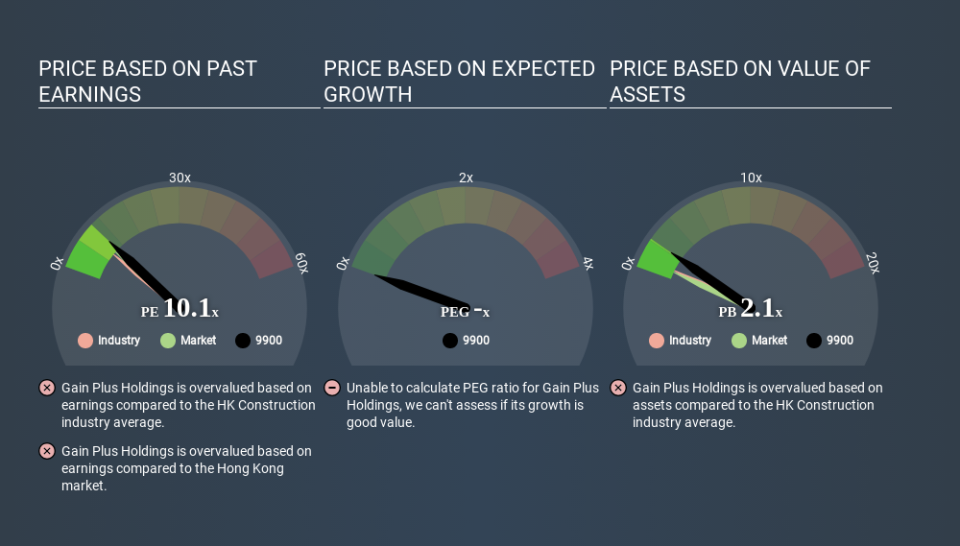
We can get an indication of market expectations by looking at the P/E ratio. You can see in the image below that the average P/E (8.2) for companies in the construction industry is lower than Gain Plus Holdings's P/E.
Gain Plus Holdings's P/E tells us that market participants think the company will perform better than its industry peers, going forward. The market is optimistic about the future, but that doesn't guarantee future growth. So investors should delve deeper. I like to check if company insiders have been buying or selling.
How Growth Rates Impact P/E Ratios
When earnings fall, the 'E' decreases, over time. That means unless the share price falls, the P/E will increase in a few years. So while a stock may look cheap based on past earnings, it could be expensive based on future earnings.
Notably, Gain Plus Holdings grew EPS by a whopping 48% in the last year. Unfortunately, earnings per share are down 4.3% a year, over 3 years.
Don't Forget: The P/E Does Not Account For Debt or Bank Deposits
Don't forget that the P/E ratio considers market capitalization. That means it doesn't take debt or cash into account. Theoretically, a business can improve its earnings (and produce a lower P/E in the future) by investing in growth. That means taking on debt (or spending its cash).
While growth expenditure doesn't always pay off, the point is that it is a good option to have; but one that the P/E ratio ignores.
Is Debt Impacting Gain Plus Holdings's P/E?
Gain Plus Holdings has net cash of HK$38m. This is fairly high at 10% of its market capitalization. That might mean balance sheet strength is important to the business, but should also help push the P/E a bit higher than it would otherwise be.
The Verdict On Gain Plus Holdings's P/E Ratio
Gain Plus Holdings has a P/E of 10.1. That's higher than the average in its market, which is 9.1. Its net cash position is the cherry on top of its superb EPS growth. So based on this analysis we'd expect Gain Plus Holdings to have a high P/E ratio.
Investors should be looking to buy stocks that the market is wrong about. If the reality for a company is better than it expects, you can make money by buying and holding for the long term. Although we don't have analyst forecasts you could get a better understanding of its growth by checking out this more detailed historical graph of earnings, revenue and cash flow.
But note: Gain Plus Holdings may not be the best stock to buy. So take a peek at this free list of interesting companies with strong recent earnings growth (and a P/E ratio below 20).
If you spot an error that warrants correction, please contact the editor at editorial-team@simplywallst.com. This article by Simply Wall St is general in nature. It does not constitute a recommendation to buy or sell any stock, and does not take account of your objectives, or your financial situation. Simply Wall St has no position in the stocks mentioned.
We aim to bring you long-term focused research analysis driven by fundamental data. Note that our analysis may not factor in the latest price-sensitive company announcements or qualitative material. Thank you for reading.

