
Gold Price Futures (GC) Technical Analysis – Weekly Trend Determined by Trader Reaction to $1286.80
December Comex Gold futures finished sharply lower after posting a two-week high early in the week. Rising Treasury yields helped make the U.S. Dollar a more attractive investment, leading to lower demand for dollar-denominated gold. Increased demand for risky assets also weighed on gold which pays neither interest nor a dividend to hold it.
The direction of the gold market this week is likely to be determined by the direction of U.S. Treasury yields and the direction of the stock market. Higher yields and rising stocks should keep pressure on gold prices.
Weekly Technical Analysis
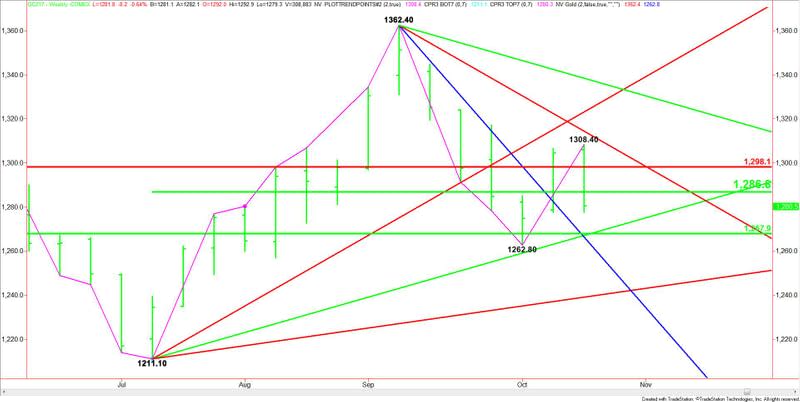
The main trend is up according to the weekly swing chart, however, momentum has been trending lower since the formation of the swing top at $1362.40 the week-ending September 8.
A trade through $1262.80 will change the main trend to down.
The major retracement zone and current support area is $1298.10 to $1267.90. The market has been straddling this zone the last five weeks. It is controlling the longer-term direction of the gold market.
The main range is $1211.10 to $1362.40. Its 50% level or pivot is $1286.80. This level falls inside the major retracement zone. It is also influencing the direction of the market. Friday’s close under this level is helping to develop a downside bias.
Weekly Forecast
Based on Friday’s close at $1280.50, the direction of the gold market this week is likely to be determined by trader reaction to the 50% level at $1286.80.
A sustained move under $1286.80 will indicate the presence of sellers. This could generate the downside momentum needed to challenge an uptrending angle at $1271.10. This is followed by the major 50% level at $1267.90 and the main bottom at $1262.80.
After the trend changes to down on a move through $1262.80, gold could plunge into a steep downtrending angle at $1250.40. Crossing to the weak side of this angle will put the market in a bearish position with $1241.10 the next major target.
Overcoming and sustaining a move over the 50% level at $1286.80 will indicate the presence of buyers. This could trigger a fast move into the Fibonacci level at $1298.10, following by a downtrending angle at $1306.40 and last week’s high at $1308.40.
Taking out $1308.40 could trigger an acceleration to the upside.
Watch the price action and read the order flow at $1286.80 all session. Trader reaction to this level will set the tone for the week.
This article was originally posted on FX Empire
