
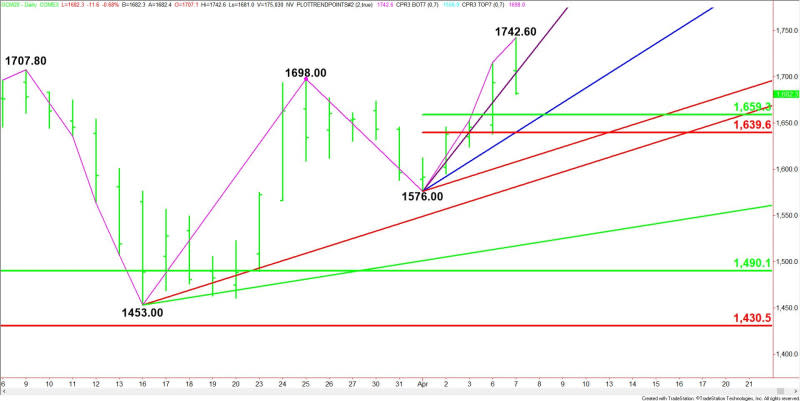
Gold Price Futures (GC) Technical Analysis – Headed into $1659.30 to $1639.60 Retracement Zone
Gold is trading lower at the mid-session after giving back earlier gains. With risk sentiment improving because of signs of progress against coronavirus outbreaks in some countries, investors may have decided to book profits in gold and deploy their capital into stocks which are undervalued and therefore have more upside potential.
At 17:29 GMT, June Comex gold is trading $1683.50, down $10.40 or -0.61%.
Daily Technical Analysis
The main trend is up according to the daily swing chart. The uptrend was confirmed earlier in the session when buyers took out yesterday’s high. A trade through $1576.00 will change the main trend to down.
More importantly, upside momentum may be slowing. The first sign of weakness is crossing below the previous main top at $1707.80. This indicates that today’s rally may have been fueled by buy stops or short-covering and not real buyers.
The second sign of weakness is turning lower for the session. This puts gold in a position to form a closing price reversal top. This may not lead to a change in trend, but it could be an indication that the selling is greater than the buying at current price levels.
The short-term range is $1576.00 to $1742.60. Its retracement zone at $1659.30 to $1639.60 is the primary downside target. Since the main trend is up, buyers are likely to come in on a test of this zone. If it fails then look for the selling to extend toward the last main top.
Daily Technical Forecast
Based on the early price action and the current price at $1693.30, the direction of the June Comex gold market the rest of the session on Tuesday is likely to be determined by trader reaction to yesterday’s close at $1693.90.
Bullish Scenario
A sustained move over $1693.90 will indicate the presence of buyers. Overcoming the steep uptrending Gann angle at $1704.00 will indicate the buying is getting stronger. If this creates enough upside momentum then look for a possible retest of the intraday high at $1742.60.
Bearish Scenario
A sustained move under $1693.90 will signal the presence of sellers. If this creates enough downside momentum then look for a test of the 50% level at $1659.30, followed by a potential support cluster at $1640.00 to $1639.60.
This article was originally posted on FX Empire
