
Here's What Best Linking Group Holdings Limited's (HKG:8617) P/E Is Telling Us

The goal of this article is to teach you how to use price to earnings ratios (P/E ratios). We'll apply a basic P/E ratio analysis to Best Linking Group Holdings Limited's (HKG:8617), to help you decide if the stock is worth further research. What is Best Linking Group Holdings's P/E ratio? Well, based on the last twelve months it is 21.34. That is equivalent to an earnings yield of about 4.7%.
View our latest analysis for Best Linking Group Holdings
How Do I Calculate A Price To Earnings Ratio?
The formula for P/E is:
Price to Earnings Ratio = Share Price ÷ Earnings per Share (EPS)
Or for Best Linking Group Holdings:
P/E of 21.34 = HK$0.475 ÷ HK$0.022 (Based on the year to December 2019.)
(Note: the above calculation results may not be precise due to rounding.)
Is A High Price-to-Earnings Ratio Good?
A higher P/E ratio means that buyers have to pay a higher price for each HK$1 the company has earned over the last year. That is not a good or a bad thing per se, but a high P/E does imply buyers are optimistic about the future.
Does Best Linking Group Holdings Have A Relatively High Or Low P/E For Its Industry?
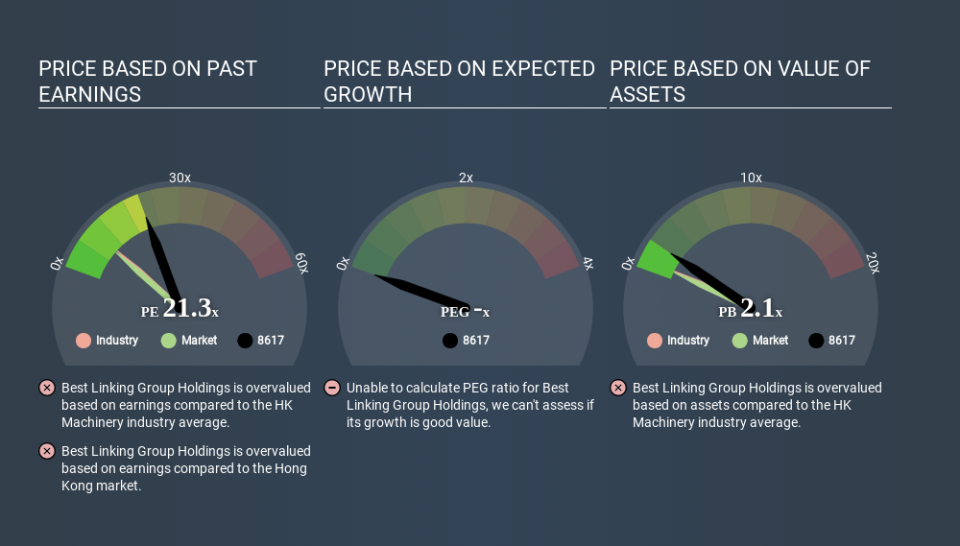
One good way to get a quick read on what market participants expect of a company is to look at its P/E ratio. The image below shows that Best Linking Group Holdings has a higher P/E than the average (9.7) P/E for companies in the machinery industry.
Best Linking Group Holdings's P/E tells us that market participants think the company will perform better than its industry peers, going forward. Clearly the market expects growth, but it isn't guaranteed. So further research is always essential. I often monitor director buying and selling.
How Growth Rates Impact P/E Ratios
Generally speaking the rate of earnings growth has a profound impact on a company's P/E multiple. If earnings are growing quickly, then the 'E' in the equation will increase faster than it would otherwise. That means even if the current P/E is high, it will reduce over time if the share price stays flat. And as that P/E ratio drops, the company will look cheap, unless its share price increases.
Best Linking Group Holdings saw earnings per share decrease by 31% last year.
Don't Forget: The P/E Does Not Account For Debt or Bank Deposits
It's important to note that the P/E ratio considers the market capitalization, not the enterprise value. Thus, the metric does not reflect cash or debt held by the company. In theory, a company can lower its future P/E ratio by using cash or debt to invest in growth.
Such spending might be good or bad, overall, but the key point here is that you need to look at debt to understand the P/E ratio in context.
So What Does Best Linking Group Holdings's Balance Sheet Tell Us?
With net cash of HK$49m, Best Linking Group Holdings has a very strong balance sheet, which may be important for its business. Having said that, at 26% of its market capitalization the cash hoard would contribute towards a higher P/E ratio.
The Verdict On Best Linking Group Holdings's P/E Ratio
Best Linking Group Holdings has a P/E of 21.3. That's higher than the average in its market, which is 9.1. The recent drop in earnings per share might keep value investors away, but the healthy balance sheet means the company retains the potential for future growth. If this growth fails to materialise, the current high P/E could prove to be temporary, as the share price falls.
When the market is wrong about a stock, it gives savvy investors an opportunity. As value investor Benjamin Graham famously said, 'In the short run, the market is a voting machine but in the long run, it is a weighing machine. We don't have analyst forecasts, but shareholders might want to examine this detailed historical graph of earnings, revenue and cash flow.
Of course, you might find a fantastic investment by looking at a few good candidates. So take a peek at this free list of companies with modest (or no) debt, trading on a P/E below 20.
If you spot an error that warrants correction, please contact the editor at editorial-team@simplywallst.com. This article by Simply Wall St is general in nature. It does not constitute a recommendation to buy or sell any stock, and does not take account of your objectives, or your financial situation. Simply Wall St has no position in the stocks mentioned.
We aim to bring you long-term focused research analysis driven by fundamental data. Note that our analysis may not factor in the latest price-sensitive company announcements or qualitative material. Thank you for reading.

