
An Intrinsic Calculation For Ascential plc (LON:ASCL) Suggests It's 41% Undervalued

How far off is Ascential plc (LON:ASCL) from its intrinsic value? Using the most recent financial data, we'll take a look at whether the stock is fairly priced by taking the foreast future cash flows of the company and discounting them back to today's value. This is done using the Discounted Cash Flow (DCF) model. Don't get put off by the jargon, the math behind it is actually quite straightforward.
Remember though, that there are many ways to estimate a company's value, and a DCF is just one method. Anyone interested in learning a bit more about intrinsic value should have a read of the Simply Wall St analysis model.
View our latest analysis for Ascential
Step by step through the calculation
We're using the 2-stage growth model, which simply means we take in account two stages of company's growth. In the initial period the company may have a higher growth rate and the second stage is usually assumed to have a stable growth rate. To start off with, we need to estimate the next ten years of cash flows. Where possible we use analyst estimates, but when these aren't available we extrapolate the previous free cash flow (FCF) from the last estimate or reported value. We assume companies with shrinking free cash flow will slow their rate of shrinkage, and that companies with growing free cash flow will see their growth rate slow, over this period. We do this to reflect that growth tends to slow more in the early years than it does in later years.
A DCF is all about the idea that a dollar in the future is less valuable than a dollar today, so we need to discount the sum of these future cash flows to arrive at a present value estimate:
10-year free cash flow (FCF) forecast
2020 | 2021 | 2022 | 2023 | 2024 | 2025 | 2026 | 2027 | 2028 | 2029 | |
Levered FCF (£, Millions) | UK£91.3m | UK£88.3m | UK£102.1m | UK£97.2m | UK£94.3m | UK£92.4m | UK£91.3m | UK£90.7m | UK£90.4m | UK£90.4m |
Growth Rate Estimate Source | Analyst x2 | Analyst x3 | Analyst x3 | Analyst x1 | Est @ -3.01% | Est @ -1.95% | Est @ -1.2% | Est @ -0.68% | Est @ -0.32% | Est @ -0.06% |
Present Value (£, Millions) Discounted @ 5.8% | UK£86.3 | UK£78.8 | UK£86.2 | UK£77.5 | UK£71.1 | UK£65.8 | UK£61.5 | UK£57.7 | UK£54.4 | UK£51.3 |
("Est" = FCF growth rate estimated by Simply Wall St)
Present Value of 10-year Cash Flow (PVCF) = UK£690m
We now need to calculate the Terminal Value, which accounts for all the future cash flows after this ten year period. For a number of reasons a very conservative growth rate is used that cannot exceed that of a country's GDP growth. In this case we have used the 10-year government bond rate (0.5%) to estimate future growth. In the same way as with the 10-year 'growth' period, we discount future cash flows to today's value, using a cost of equity of 5.8%.
Terminal Value (TV)= FCF2029 × (1 + g) ÷ (r – g) = UK£90m× (1 + 0.5%) ÷ 5.8%– 0.5%) = UK£1.7b
Present Value of Terminal Value (PVTV)= TV / (1 + r)10= UK£1.7b÷ ( 1 + 5.8%)10= UK£976m
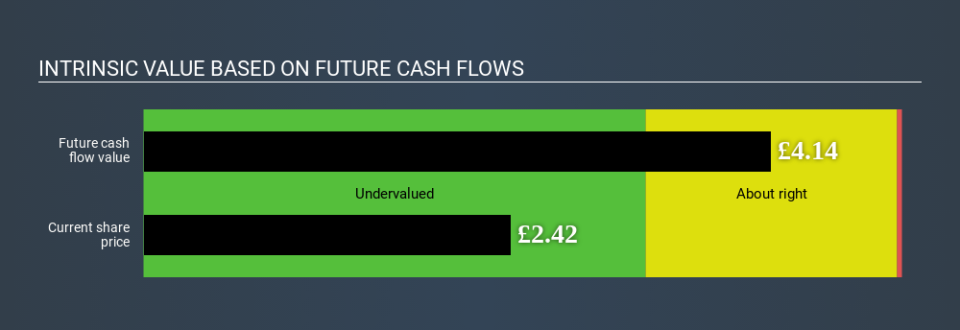
The total value, or equity value, is then the sum of the present value of the future cash flows, which in this case is UK£1.7b. To get the intrinsic value per share, we divide this by the total number of shares outstanding. Relative to the current share price of UK£2.4, the company appears quite good value at a 41% discount to where the stock price trades currently. Valuations are imprecise instruments though, rather like a telescope - move a few degrees and end up in a different galaxy. Do keep this in mind.
Important assumptions
We would point out that the most important inputs to a discounted cash flow are the discount rate and of course the actual cash flows. If you don't agree with these result, have a go at the calculation yourself and play with the assumptions. The DCF also does not consider the possible cyclicality of an industry, or a company's future capital requirements, so it does not give a full picture of a company's potential performance. Given that we are looking at Ascential as potential shareholders, the cost of equity is used as the discount rate, rather than the cost of capital (or weighted average cost of capital, WACC) which accounts for debt. In this calculation we've used 5.8%, which is based on a levered beta of 0.871. Beta is a measure of a stock's volatility, compared to the market as a whole. We get our beta from the industry average beta of globally comparable companies, with an imposed limit between 0.8 and 2.0, which is a reasonable range for a stable business.
Next Steps:
Although the valuation of a company is important, it shouldn’t be the only metric you look at when researching a company. The DCF model is not a perfect stock valuation tool. Rather it should be seen as a guide to "what assumptions need to be true for this stock to be under/overvalued?" If a company grows at a different rate, or if its cost of equity or risk free rate changes sharply, the output can look very different. What is the reason for the share price to differ from the intrinsic value? For Ascential, There are three pertinent aspects you should further examine:
Risks: Be aware that Ascential is showing 4 warning signs in our investment analysis , you should know about...
Future Earnings: How does ASCL's growth rate compare to its peers and the wider market? Dig deeper into the analyst consensus number for the upcoming years by interacting with our free analyst growth expectation chart.
Other Solid Businesses: Low debt, high returns on equity and good past performance are fundamental to a strong business. Why not explore our interactive list of stocks with solid business fundamentals to see if there are other companies you may not have considered!
PS. Simply Wall St updates its DCF calculation for every GB stock every day, so if you want to find the intrinsic value of any other stock just search here.
If you spot an error that warrants correction, please contact the editor at editorial-team@simplywallst.com. This article by Simply Wall St is general in nature. It does not constitute a recommendation to buy or sell any stock, and does not take account of your objectives, or your financial situation. Simply Wall St has no position in the stocks mentioned.
We aim to bring you long-term focused research analysis driven by fundamental data. Note that our analysis may not factor in the latest price-sensitive company announcements or qualitative material. Thank you for reading.
