
How Many Transurban Group (ASX:TCL) Shares Do Institutions Own?

If you want to know who really controls Transurban Group (ASX:TCL), then you'll have to look at the makeup of its share registry. Large companies usually have institutions as shareholders, and we usually see insiders owning shares in smaller companies. We also tend to see lower insider ownership in companies that were previously publicly owned.
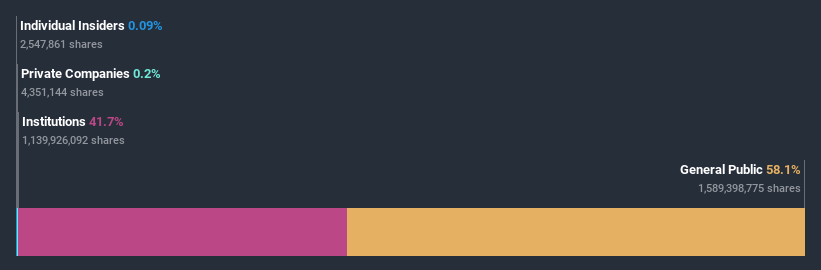
Transurban Group is a pretty big company. It has a market capitalization of AU$40b. Normally institutions would own a significant portion of a company this size. Taking a look at our data on the ownership groups (below), it seems that institutions are noticeable on the share registry. We can zoom in on the different ownership groups, to learn more about Transurban Group.
See our latest analysis for Transurban Group
What Does The Institutional Ownership Tell Us About Transurban Group?
Institutions typically measure themselves against a benchmark when reporting to their own investors, so they often become more enthusiastic about a stock once it's included in a major index. We would expect most companies to have some institutions on the register, especially if they are growing.
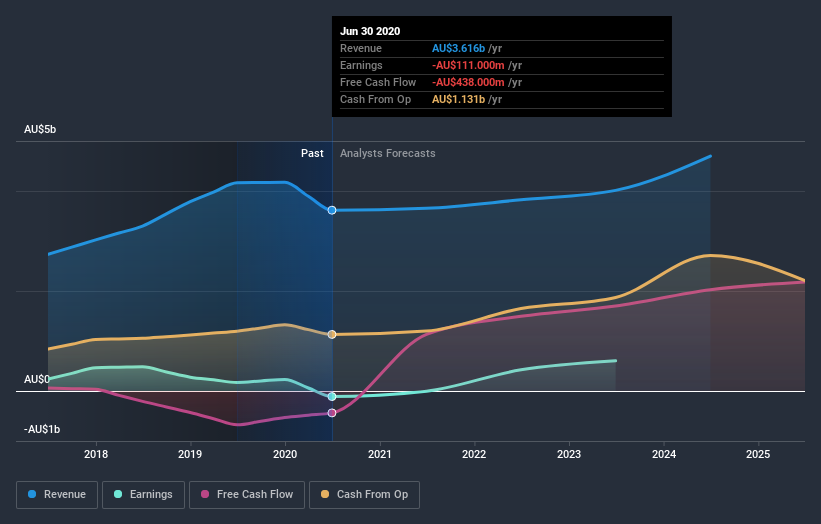
As you can see, institutional investors have a fair amount of stake in Transurban Group. This suggests some credibility amongst professional investors. But we can't rely on that fact alone since institutions make bad investments sometimes, just like everyone does. When multiple institutions own a stock, there's always a risk that they are in a 'crowded trade'. When such a trade goes wrong, multiple parties may compete to sell stock fast. This risk is higher in a company without a history of growth. You can see Transurban Group's historic earnings and revenue below, but keep in mind there's always more to the story.
Hedge funds don't have many shares in Transurban Group. UniSuper Management Pty Limited is currently the largest shareholder, with 12% of shares outstanding. In comparison, the second and third largest shareholders hold about 7.1% and 6.0% of the stock.
A deeper look at our ownership data shows that the top 25 shareholders collectively hold less than half of the register, suggesting a large group of small holders where no single shareholder has a majority.
While it makes sense to study institutional ownership data for a company, it also makes sense to study analyst sentiments to know which way the wind is blowing. Quite a few analysts cover the stock, so you could look into forecast growth quite easily.
Insider Ownership Of Transurban Group
While the precise definition of an insider can be subjective, almost everyone considers board members to be insiders. Management ultimately answers to the board. However, it is not uncommon for managers to be executive board members, especially if they are a founder or the CEO.
Most consider insider ownership a positive because it can indicate the board is well aligned with other shareholders. However, on some occasions too much power is concentrated within this group.
Our data suggests that insiders own under 1% of Transurban Group in their own names. Being so large, we would not expect insiders to own a large proportion of the stock. Collectively, they own AU$37m of stock. In this sort of situation, it can be more interesting to see if those insiders have been buying or selling.
General Public Ownership
The general public -- mostly retail investors -- own 58% of Transurban Group. This size of ownership gives retail investors collective power. They can and probably do influence decisions on executive compensation, dividend policies and proposed business acquisitions.
Next Steps:
I find it very interesting to look at who exactly owns a company. But to truly gain insight, we need to consider other information, too. For instance, we've identified 2 warning signs for Transurban Group that you should be aware of.
If you would prefer discover what analysts are predicting in terms of future growth, do not miss this free report on analyst forecasts.
NB: Figures in this article are calculated using data from the last twelve months, which refer to the 12-month period ending on the last date of the month the financial statement is dated. This may not be consistent with full year annual report figures.
This article by Simply Wall St is general in nature. It does not constitute a recommendation to buy or sell any stock, and does not take account of your objectives, or your financial situation. We aim to bring you long-term focused analysis driven by fundamental data. Note that our analysis may not factor in the latest price-sensitive company announcements or qualitative material. Simply Wall St has no position in any stocks mentioned.
Have feedback on this article? Concerned about the content? Get in touch with us directly. Alternatively, email editorial-team@simplywallst.com.

