
Reflecting on SKYCITY Entertainment Group's (NZSE:SKC) Share Price Returns Over The Last Five Years

In order to justify the effort of selecting individual stocks, it's worth striving to beat the returns from a market index fund. But the main game is to find enough winners to more than offset the losers At this point some shareholders may be questioning their investment in SKYCITY Entertainment Group Limited (NZSE:SKC), since the last five years saw the share price fall 43%. And it's not just long term holders hurting, because the stock is down 37% in the last year. Unhappily, the share price slid 2.3% in the last week.
View our latest analysis for SKYCITY Entertainment Group
In his essay The Superinvestors of Graham-and-Doddsville Warren Buffett described how share prices do not always rationally reflect the value of a business. By comparing earnings per share (EPS) and share price changes over time, we can get a feel for how investor attitudes to a company have morphed over time.
During the unfortunate half decade during which the share price slipped, SKYCITY Entertainment Group actually saw its earnings per share (EPS) improve by 32% per year. So it doesn't seem like EPS is a great guide to understanding how the market is valuing the stock. Alternatively, growth expectations may have been unreasonable in the past.
Because of the sharp contrast between the EPS growth rate and the share price growth, we're inclined to look to other metrics to understand the changing market sentiment around the stock.
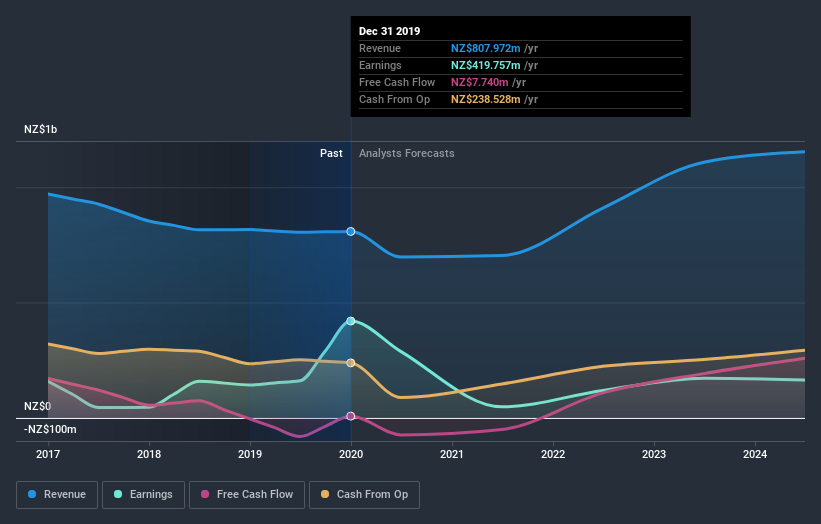
The steady dividend doesn't really explain why the share price is down. However, revenue has declined at a compound annual rate of 3.7% per year. With dividends up, but revenue down, some investors might be concluding that the company is no longer growing.
You can see how earnings and revenue have changed over time in the image below (click on the chart to see the exact values).
We know that SKYCITY Entertainment Group has improved its bottom line over the last three years, but what does the future have in store? This free interactive report on SKYCITY Entertainment Group's balance sheet strength is a great place to start, if you want to investigate the stock further.
What About Dividends?
When looking at investment returns, it is important to consider the difference between total shareholder return (TSR) and share price return. Whereas the share price return only reflects the change in the share price, the TSR includes the value of dividends (assuming they were reinvested) and the benefit of any discounted capital raising or spin-off. So for companies that pay a generous dividend, the TSR is often a lot higher than the share price return. We note that for SKYCITY Entertainment Group the TSR over the last 5 years was -23%, which is better than the share price return mentioned above. This is largely a result of its dividend payments!
A Different Perspective
SKYCITY Entertainment Group shareholders are down 33% for the year (even including dividends), but the market itself is up 3.9%. Even the share prices of good stocks drop sometimes, but we want to see improvements in the fundamental metrics of a business, before getting too interested. Regrettably, last year's performance caps off a bad run, with the shareholders facing a total loss of 4.3% per year over five years. Generally speaking long term share price weakness can be a bad sign, though contrarian investors might want to research the stock in hope of a turnaround. I find it very interesting to look at share price over the long term as a proxy for business performance. But to truly gain insight, we need to consider other information, too. Case in point: We've spotted 4 warning signs for SKYCITY Entertainment Group you should be aware of, and 2 of them are significant.
For those who like to find winning investments this free list of growing companies with recent insider purchasing, could be just the ticket.
Please note, the market returns quoted in this article reflect the market weighted average returns of stocks that currently trade on NZ exchanges.
This article by Simply Wall St is general in nature. It does not constitute a recommendation to buy or sell any stock, and does not take account of your objectives, or your financial situation. We aim to bring you long-term focused analysis driven by fundamental data. Note that our analysis may not factor in the latest price-sensitive company announcements or qualitative material. Simply Wall St has no position in any stocks mentioned.
Have feedback on this article? Concerned about the content? Get in touch with us directly. Alternatively, email editorial-team@simplywallst.com.
