
How to Spot a Real Estate Bubble
You don't need a great memory to recall the last real estate bubble. Just 10 years ago, an implosion in the United States housing market and several others around the globe catapulted the world into the worst financial crisis since the Great Depression. The S&P 500 lost half of its value, the unemployment rate doubled, several investment banks were forced to dissolve or merge in order to survive, and millions of Americans were foreclosed on and lost their homes. Millions of others simply abandoned them as the homes were underwater or worth less than what they owed on their mortgages.
It's no wonder, then, that homebuyers and others, especially in areas with limited housing supply like Silicon Valley, San Francisco, and Los Angeles, may be nervous about the next real estate bubble as home prices are rising and buying a home is generally the biggest investment that Americans make in their lifetimes.
Though there's no definitive way to spot a real estate bubble and experts don't even agree on whether one can be identified or prevented, there are a number of indicators that homebuyers and shoppers can follow in order to determine the likelihood of a bubble. Those indicators include:
Interest rates since low rates tend to fuel bubbles.
Home price indexes, a measurement of housing prices for single-family homes in a given location. These offer the easiest way to follow the rise and fall of home prices.
Price-to-rent ratio, which is the ratio of the price of home to the annual rent that it would generate and a measure of affordability of renting versus buying. Lower ratios indicate that buying is cheaper, while higher ratios would signify that renting is the better deal. Price-to-rent ratios tend to rise during a bubble as speculative interest in homebuying lifts home prices.
Determine to what extent rising prices are being driven by speculators rather than residents as housing bubbles tend to be driven by speculators, or investors who are buying homes to turn a quick profit, rather than live in them.
We'll go into those techniques later, but let's first define the key term here and go over some basics that every homebuyer and investor should understand.
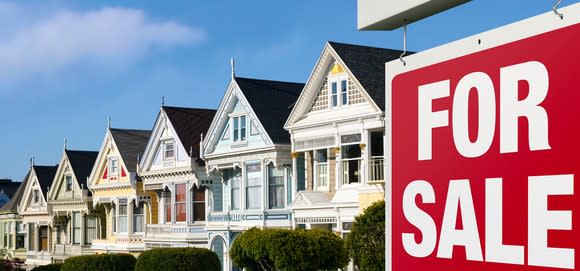
Image source: Getty Images.
What is a real estate bubble?
A bubble is simply a sudden escalation in the price of an asset class, such as housing, due to increased demand or speculation.
The term is often used when the rise in prices is divorced from the underlying value of the asset and followed by a rapid decline. The bubble is so named for its appearance on a chart as the asset price suddenly rises and then falls, creating the rounded shape of a bubble. A bubble often emerges from supply and demand dynamics becoming imbalanced. When demand for housing exceeds supply, which most often happens in cities with geographic boundaries like San Francisco, Seattle, or New York that have booming economies, prices tend to escalate. Speculators and other investors may seize on the opportunity, buying housing in order to turn a profit rather than live in the home -- a process sometimes called flipping. Eventually, the imbalance tends to correct itself and higher prices drive down demand or supply catches up with the higher level of demand through new construction. Investors don't generally know when they're in a bubble or how long it will last, though there are usually critics who recognize it as such.
In real estate, bubbles take place in the housing market, commercial property, or, simply, land, and all have been a popular target for speculators over U.S. history since there's a constant need for real estate and housing, banks are generally willing to lend money for real estate and housing purchases, and its high value can allow for large profits.
According to the International Monetary Fund, real estate bubbles are less frequent than equity, or stock market, bubbles. Real estate bubbles occur every 13 years on average, but last twice as long as the 2.5 years that stock market bubbles last. Real estate bubbles also lead to double the loss in output of the 4% decline in gross domestic product, or GDP, caused by equity bubbles. GDP is defined as the total value of all the goods and services produced by a country, or a similar entity, in one year.
In today's market, when investors refer to a real estate bubble, they are generally talking about the housing market as that was the most significant driver of the last real estate bubble as well as the financial crisis, and remains the biggest concern for homebuyers today.
A brief history of housing bubbles
Dating back to 1800, when the U.S. government first began selling off federal land, real estate bubbles in land sales and real estate construction peaked every 18 years, almost like clockwork until 1944. Peaks in the value of land prices have been generally followed by peaks in construction activity and then peaks in the general economy.
In 1836, for example, the number of acres sold reached more than 20 million, nearly 10 times what it had been before the run-up in sales as "speculative mania" drove a rampant and unprecedented land boom. Westward expansion and the Indian Removal Act, which President Andrew Jackson signed earlier in the decade, may have contributed to the mania, but an economic crash known as the Panic of 1837 came the following year, spelling an end to the exuberance.
From 1800-1944, the degree of the peaks in land sold varied significantly, but the timing, or cyclicality, was relatively consistent. That pattern continued following World War II and the prosperity of the 1950s as recessions, or housing busts, occurred in 1974, 1992, and 2009. In other words, housing booms and busts may just be a normal part of the economic cycle, but the degree of the bubble or the bust is what makes them dangerous to investors and homebuyers.
More recently, the best-known housing bubble, in the 2000s was fueled in part by the aftermath of the dot-com bubble bursting as a rally in tech stocks in the late 1990s gave way to a crash. Once investors began pulling money out of tech stocks as that market began crashing, they looked for a new asset class to target and found real estate appealing. Lower interest rates helped fuel the rally as the Federal Reserve lowered rates to soften the blow from the dot-com crash and encourage lending, which the central bank normally does during a recession.
Real estate prices, unusually, rose through the 2001-2002 recession, and continued to surge due to lax lending standards, speculation, and the popularity of house flipping as investors in many markets saw an easy opportunity to turn a profit. Banks took notice and pooled mortgages into collateralized debt obligations on home loans. A collateralized debt obligation (CDO) is a complex financial product that groups cash-producing loans, such as mortgages, into a bundle and divides them into tranches, or slices, based on things like the interest rate and level of risk. Those are then sold to different investors based on their appetite for risk.
CDO's subsequently helped cause the financial crisis as financial professionals did a poor job of assessing the default risk of these assets. When homebuyers who wouldn't have qualified to get a mortgage under stricter standards defaulted on those loans, the banks' activity turned what would have been an ordinary decline in real estate prices into a full-fledged crisis, eventually leading to stricter regulations on banking activity and mortgage lending.
The impact of the housing bubble's bursting and the subsequent financial crisis was vast. Lehman Brothers, the investment bank, went under, and several other banks, including Merrill Lynch and Wachovia, had to be acquired by other banks, in their case Bank of America and Wells Fargo, respectively, with the oversight of the federal government. All told, dozens of banks and financial institutions around the globe went bankrupt or had to be acquired. In 2008, there were more than 3.1 million home foreclosures, more than triple the number in 2006, and home prices fell about 30% from their peak in 2006 to their trough in early 2012.
The local effect
Unlike equity bubbles or the cryptocurrency bubble, real estate bubbles tend to be localized as real estate markets differ widely from city to city. For example, the recent real estate bubble was much more extreme in coastal markets such as Florida and Las Vegas that are seeing fast growth or where housing was already scarce. Such parts of the country have a history of real estate speculation and have long been attractive destinations to Americans from other parts of the country. By contrast, the rise in home prices during the bubble years was more modest across much of the Midwest as population levels have not been increasing in that region the way they have across much of the Sunbelt. As a result, prices did not fall as sharply when the bubble burst.
Another key question to ask is whether rising real estate prices represent a housing bubble or just a strong housing market. In tight markets, housing prices can grow faster than the rate of inflation but that doesn't mean that a bubble is being created. For example, in Manhattan, the median home price has risen steadily from $400,000 in 2000 to $1.29 million in March 2018. Though prices pulled back about 15% during the financial crisis, the New York market didn't see anything like the crash that other metropolitan areas experienced. In fact, the housing market has easily outperformed the S&P 500 during that time, which only increased by 90%.
The San Francisco market has seen a similar appreciation, rising from a median home price of $415,000 to $1,350,000, and saw a similarly modest pullback during the financial crisis. Both markets have boomed for similar reasons. They have geographic constraints that naturally limit the housing -- Manhattan is an island, San Francisco is a peninsula --and are home to booming, high-paying industries: finance/banking and media, among others, in New York, and tech in San Francisco and the surrounding Silicon Valley. In San Francisco, housing prices have doubled in the last six years as the mobile economy has heated up.
Because both of those cities have high demand for housing, their real estate markets should avoid a bubble as long as the local economy remains strong enough to support the corresponding home prices.
For homebuyers trying to measure the strength of the local economy, some key indicators to watch are average household income, population growth, and the local unemployment rate. Demand for housing can also help shed light on the strength of the housing market as housing inventory, measured by the number of months the average house stays on the market, is the one of the best indicators for housing demand, along with home prices themselves.
If inventory levels are near or below their historical averages, that indicates that the housing market is solid, as demand is keeping up with supply.
Let's take at some of the key questions homebuyers and investors should ask to determine whether their cities are in a real estate bubble.
1. What are mortgage rates and where are they going?
There may be no more impact factor in influencing home prices than interest rates. Low interest rates encourage homebuying as most homebuyers use a mortgage to a buy a new home. The lower the mortgage rate, the less the actual cost of their monthly payment would be, effectively making the home cheaper to buy for them. Though a mortgage rate does not directly affect the price of a home, it does affect the cost to the buyer. Higher interest rates, on the other hand, tend to cool off the housing market as they make buying a home effectively more expensive.
For example, a $500,000 mortgage at 4% over 30 years would cost just $2,387 a month, while the same loan at 7% would cost nearly $1,000 more per month at $3,327, meaning the borrower would pay over $300,000 more over the lifetime of the loan.
Consequently, interest rates have a direct effect on the housing market as low rates will encourage buying, which can increase housing demand, leading to dwindling housing supply, and eventually higher prices.
Therefore, real estate prices are more likely to go up when rates are low or falling, while rising rates are likely to tighten the market or cool off homebuying, assuming all other things remain equal. Mortgage rates vary depending on the lender and the borrower, but according to Bankrate, the lowest available rate for a 30-year fixed mortgage, which is the most popular type in the U.S., is currently 4.375%. While that is up from the modern-era low of 3.31%, it is significantly below the average of 8.2% since 1981, according to ValuePenguin.
The Federal Reserve does not directly control mortgage rates, but it does set the federal funds rate, which is the rate that banks lend federal reserve funds to each other overnight to meet federal liquidity requirements. The rate generally acts as a basis for all other interest rates, including mortgage rates, so mortgage rates are likely to go up if the federal funds rate does as well.
The federal funds rate is adjusted by the Federal Reserve to help control inflation and encourage growth. In a healthy economy, the Fed tends to raise rates, which discourages borrowing by raising interest rates, and therefore keeps the economy from overheating and inflation under control. In a recessionary climate, the Fed lowers the funds rate to encourage borrowing and to help boost the economy.
Rising mortgage rates will likely cool off the housing market and could also bring housing prices down. During the housing bubble of a decade ago, mortgage rates were lower than average, hovering around 6%, but still above today's lows. In other words, low mortgage rates can encourage a bubble-like atmosphere, but it is just one of many factors that come into play.
Some analysts believe that rising mortgage rates have encouraged homebuying as homebuyers want to lock in low rates while they still can. If that proves to be the case, higher mortgage rates will eventually cool off the housing market. The effect of rising mortgage rates will just be delayed.
2. What are home prices? How do they compare to other assets and inflation?
One of the most obvious indications of a housing bubble is rising home prices, and one of the best ways to track those is with the S&P CoreLogic Case-Shiller Home Price Index, considered the leading measure of U.S. residential real estate prices.
The Case-Shiller Index is normalized to have a value of 100 in January 2000, so index values are relative to what they were then. For instance, 150 on the Case-Shiller Index would indicate that home prices are 50% above where they were on January 2000, though that doesn't include the effect of inflation.
The Case-Shiller peaked during the housing bubble years at 190 in the second quarter of 2006, then bottomed out in February 2012 at 134 around the same time that mortgage rates also hit their nadir. However, by March 2018, the Case-Shiller index was at 199 a meaning nationwide home prices rose about 50% over six years, or at a compound annual growth rate of about 7%. (Keep in mind that the index is not adjusted for inflation.) That growth has outpaced inflation, which has ranged between 0% and 2% for much of that time, and wage growth, which has been in the low single digits. However, those gains have been slower than the stock market as the S&P 500 has doubled during that time. Those numbers make it seem more likely that we're in a stock market bubble rather than a housing bubble.
The growth in housing prices over the last six years is also significantly slower than the 81% rise in home prices that we saw during the six-year period from 2000-2006, which was equivalent to a 10.4% compound annual growth.
By contrast, stocks were in free fall for the first half of that period, and the S&P 500 was actually down 15% over that six-year period, signaling that investors saw opportunity in the housing market, rather than in stocks. What was also different was that housing prices were not at a bottom in 2000, and had risen steadily since a modest dip in the early 1990s.
Of course, local markets can differ substantially from national averages. The Case-Shiller Index also provides local data from 20 metro areas in the country, and some markets have seen faster growth than others. In Los Angeles, the index has risen 74% in 2012-2018 or 9.7% annually, however, that's still significantly slower than the 164% jump the region experienced from 2000-2006.
In San Francisco, the rise has been even sharper over the last six years, as home prices have risen 110% according to the index, similar to the 116% boom they saw from 2000-2006, as the recent housing boom seems to be driven by the massive growth of the tech industry.
Finally, Seattle represents another market that's heated up recently in large part because of Amazon's expansion. In the Emerald City, home prices have risen 90% over the last six years, slower than the growth in San Francisco, but that pace exceeded the 63% run-up home prices experienced during the bubble years of 2000-2006. That may explain why Seattleites are particularly fearful of a housing bubble this time. Driving the rise in housing prices is the number of employees at Amazon, which has jumped tenfold from 2011 to 2017, reaching 566,000. While only 40,000 of those are in Seattle, that still marks significant growth from just 5,000 employees in the city in 2010, and Amazonians, as Seattle's Amazon workforce is called, tend to be well paid.
Seattle is also now the fastest-growing big city in the U.S. with a population increase of 117,000 over the last decade to 725,000, an increase of 19%.
3. What is the price-to-rent ratio? Is it rising?
The price-to-rent ratio is another key indicator for homebuyers and investors to watch. This shows how expensive home prices are relative to local rents. It's important for potential buyers to be aware of it as it helps let them know if they'd be better off renting instead of buying. It's also a useful tool for gauging the likelihood of a housing bubble as the ratio tends to rise in a bubble due to euphoria around rising home prices. Identifying when home prices outpace the rise in rental rates can be a big indicator of a bubble as that number is likely to revert to the mean over time as the housing market rebalances.
Elevated price-to-rent ratios can also be signs that homes are being bought by speculators rather than residents, and they are being held to make a quick profit (i.e. flipping), rather than rented out. That's because ordinary residents would choose to rent instead of a buy if home prices were so stretched compared to rents. However, when houses are viewed as investments rather than as residences to live in, the prices would still go up but rents would be unaffected.
For instance, in 2006, during the height of the housing bubble the national price-to-rent peaked at 28% above its historical average. As of the second quarter of 2016, according to The Economist, the index was below its historical average, indicating a low likelihood of a housing bubble, at least on a national scale.
As of two years ago, Los Angeles was the only one of the highest-priced markets to have a price-to-rent ratio significantly above the historical average, at 17% higher, as new home construction seems to have been fast enough to keep rents down relative to fast-increasing purchase prices.
Average price-to-rent ratios themselves can differ widely from market to market so it's best to look at this data on a local level. Sites like Trulia can help with this as the real-estate site said that a year ago Philadelphia had one of the lowest price-to-rent ratios at 9.7, while San Jose had one of the highest at 23.3.
In general, higher-income, denser markets like San Jose tend to have higher price-to-rent ratios as demand for homes is greater relative to supply and residents can afford to spend more. In the San Jose metro area, the median household income is $110,000, compared to just $66,000 in the Philadelphia metro area.
Meanwhile, San Jose's population has steadily grown over the last generation while Philadelphia's has remained flat.
4. Is the market being driven by speculators or homebuyers?
There's no easy way to answer this question. It's more of a qualitative than a quantitative one. However, looking for news reports about things like home flipping or foreign investors buying luxury properties can help point to bubbles. A quick Google search for home flipping in your city or real estate market can help answer the question of whether this trend is active or on the rise. Also, look for reports in the real estate section of your local newspaper, which often highlights trends in the real estate market.
It's also a good idea to talk to real estate agents, lenders and others who know the market best to get an answer to this question.
Other indicators that can help guide homebuyers are things like local economic indicators such as income growth, unemployment, and changes in population. If home prices are rising due to a booming job market as seems to be the case in places like San Francisco and Seattle, that's an indicator that rising home prices are justified by greater economic growth. In Seattle, for example, median household income rose 4% last year, which would justify an increase in housing prices of at least 4%, or likely higher considering the rapid increase in population, and constrained housing supply. Or, it could turn into a housing bubble if the labor market suddenly crashes as housing prices are closely connected to other parts of the economy.
If Amazon were forced to lay off thousands of employees, for example, the Seattle housing market would likely take a dive. If the local economy is thriving, however, especially in a city with limited space to build, it shouldn't be a surprise to find rising home prices. That's simply the effect of supply and demand.
If on the other hand, home prices are skyrocketing without corresponding growth in the local economy, then that would be a strong sign of a bubble as growth in home prices are being fueled by speculation or the greater fool theory, which states that someone will buy whatever asset you buy at a higher price. That belief seemed to have fueled the housing bubble and home-flipping bonanza in the 2000s.
Are we in a real estate bubble?
Some speculation is a normal part of the real estate market, but the rampant home-flipping we saw during the housing bubble of the 2000's was a clear sign of something awry as was the boom in subprime lending.
Though housing prices are on the rise today and are outpacing wage growth and inflation, it's nothing like the housing bubble of the 2000's as the economy is booming and stocks are growing at an even faster pace. Whether or not we are in a bubble depends on your definition of the term as we may be in a modest bubble, especially in some markets. Housing prices will eventually fall as is a natural part of any cyclical economy. No one knows by how much, but it likely won't be like the crash of a decade ago as financial regulations and lending standards have tightened, and both bankers and borrowers are wary of repeating the same mistakes. .
However, for the most part, the last six years have not seen the kind of rapid and parabolic rise in home prices that crushed cities like Las Vegas and Miami a decade ago. In Las Vegas, for example, home prices jumped 130% from 2000 to 2006, surging a whopping 46% in 2004 alone. Meanwhile, in Miami, home prices skyrocketed 165% from 2000 to 2006, but especially heated up the last two years of that time frame rising 62%.
Even in the hottest real estate markets today like San Francisco's, prices have not accelerated like this. That's a sign that the market is not falling victim to the type of euphoria and speculation that causes asset prices to turn "parabolic."
It's almost impossible to say when the real estate market will peak, and homebuyers and investors are best off monitoring the local economic climate in their areas. Home prices will pull back at some point just as a recession will eventually come, but many of the factors that led to the last bubble such as lax lending standards, a surge in the price-to-rent ratio, and a rash of home flipping, seem to be mostly absent from today's real estate market.
Therefore, the next pullback in housing prices almost definitely won't be as bad as the last.
More From The Motley Fool
John Mackey, CEO of Whole Foods Market, an Amazon subsidiary, is a member of The Motley Fool's board of directors. Jeremy Bowman has no position in any of the stocks mentioned. The Motley Fool owns shares of and recommends Amazon. The Motley Fool has a disclosure policy.
