
TD Holdings, Inc. (NASDAQ:GLG) most popular amongst individual investors who own 56%, insiders hold 44%
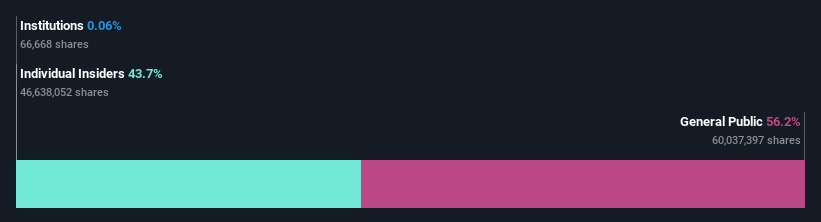
A look at the shareholders of TD Holdings, Inc. (NASDAQ:GLG) can tell us which group is most powerful. We can see that individual investors own the lion's share in the company with 56% ownership. Put another way, the group faces the maximum upside potential (or downside risk).
Individual insiders, on the other hand, account for 44% of the company's stockholders. Generally speaking, as a company grows, institutions will increase their ownership. Conversely, insiders often decrease their ownership over time.
In the chart below, we zoom in on the different ownership groups of TD Holdings.
See our latest analysis for TD Holdings
What Does The Lack Of Institutional Ownership Tell Us About TD Holdings?
Institutional investors often avoid companies that are too small, too illiquid or too risky for their tastes. But it's unusual to see larger companies without any institutional investors.
There are multiple explanations for why institutions don't own a stock. The most common is that the company is too small relative to funds under management, so the institution does not bother to look closely at the company. It is also possible that fund managers don't own the stock because they aren't convinced it will perform well. Institutional investors may not find the historic growth of the business impressive, or there might be other factors at play. You can see the past revenue performance of TD Holdings, for yourself, below.

We note that hedge funds don't have a meaningful investment in TD Holdings. Looking at our data, we can see that the largest shareholder is Shuxiang Zhang with 17% of shares outstanding. Meanwhile, the second and third largest shareholders, hold 13% and 5.2%, of the shares outstanding, respectively. Renmei Ouyang, who is the second-largest shareholder, also happens to hold the title of Chief Executive Officer.
A deeper look at our ownership data shows that the top 13 shareholders collectively hold less than half of the register, suggesting a large group of small holders where no single shareholder has a majority.
While studying institutional ownership for a company can add value to your research, it is also a good practice to research analyst recommendations to get a deeper understand of a stock's expected performance. Our information suggests that there isn't any analyst coverage of the stock, so it is probably little known.
Insider Ownership Of TD Holdings
While the precise definition of an insider can be subjective, almost everyone considers board members to be insiders. Company management run the business, but the CEO will answer to the board, even if he or she is a member of it.
I generally consider insider ownership to be a good thing. However, on some occasions it makes it more difficult for other shareholders to hold the board accountable for decisions.
It seems insiders own a significant proportion of TD Holdings, Inc.. It has a market capitalization of just US$123m, and insiders have US$54m worth of shares in their own names. This may suggest that the founders still own a lot of shares. You can click here to see if they have been buying or selling.
General Public Ownership
The general public -- including retail investors -- own 56% of TD Holdings. This level of ownership gives investors from the wider public some power to sway key policy decisions such as board composition, executive compensation, and the dividend payout ratio.
Next Steps:
While it is well worth considering the different groups that own a company, there are other factors that are even more important. Consider for instance, the ever-present spectre of investment risk. We've identified 1 warning sign with TD Holdings , and understanding them should be part of your investment process.
Of course this may not be the best stock to buy. Therefore, you may wish to see our free collection of interesting prospects boasting favorable financials.
NB: Figures in this article are calculated using data from the last twelve months, which refer to the 12-month period ending on the last date of the month the financial statement is dated. This may not be consistent with full year annual report figures.
Have feedback on this article? Concerned about the content? Get in touch with us directly. Alternatively, email editorial-team (at) simplywallst.com.
This article by Simply Wall St is general in nature. We provide commentary based on historical data and analyst forecasts only using an unbiased methodology and our articles are not intended to be financial advice. It does not constitute a recommendation to buy or sell any stock, and does not take account of your objectives, or your financial situation. We aim to bring you long-term focused analysis driven by fundamental data. Note that our analysis may not factor in the latest price-sensitive company announcements or qualitative material. Simply Wall St has no position in any stocks mentioned.
Join A Paid User Research Session
You’ll receive a US$30 Amazon Gift card for 1 hour of your time while helping us build better investing tools for the individual investors like yourself. Sign up here

