
Here’s why Elecster Oyj’s (HEL:ELEAV) Returns On Capital Matters So Much

Today we are going to look at Elecster Oyj (HEL:ELEAV) to see whether it might be an attractive investment prospect. To be precise, we'll consider its Return On Capital Employed (ROCE), as that will inform our view of the quality of the business.
First, we'll go over how we calculate ROCE. Then we'll compare its ROCE to similar companies. Then we'll determine how its current liabilities are affecting its ROCE.
Understanding Return On Capital Employed (ROCE)
ROCE measures the amount of pre-tax profits a company can generate from the capital employed in its business. Generally speaking a higher ROCE is better. Ultimately, it is a useful but imperfect metric. Author Edwin Whiting says to be careful when comparing the ROCE of different businesses, since 'No two businesses are exactly alike.
So, How Do We Calculate ROCE?
Analysts use this formula to calculate return on capital employed:
Return on Capital Employed = Earnings Before Interest and Tax (EBIT) ÷ (Total Assets - Current Liabilities)
Or for Elecster Oyj:
0.057 = €2.2m ÷ (€50m - €11m) (Based on the trailing twelve months to December 2019.)
So, Elecster Oyj has an ROCE of 5.7%.
View our latest analysis for Elecster Oyj
Does Elecster Oyj Have A Good ROCE?
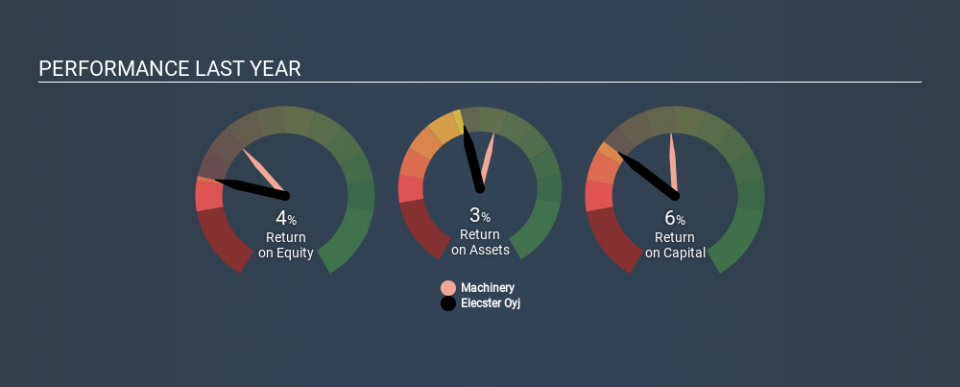
When making comparisons between similar businesses, investors may find ROCE useful. In this analysis, Elecster Oyj's ROCE appears meaningfully below the 10% average reported by the Machinery industry. This could be seen as a negative, as it suggests some competitors may be employing their capital more efficiently. Aside from the industry comparison, Elecster Oyj's ROCE is mediocre in absolute terms, considering the risk of investing in stocks versus the safety of a bank account. Investors may wish to consider higher-performing investments.
Elecster Oyj's current ROCE of 5.7% is lower than 3 years ago, when the company reported a 12% ROCE. Therefore we wonder if the company is facing new headwinds. You can see in the image below how Elecster Oyj's ROCE compares to its industry. Click to see more on past growth.
Remember that this metric is backwards looking - it shows what has happened in the past, and does not accurately predict the future. ROCE can be deceptive for cyclical businesses, as returns can look incredible in boom times, and terribly low in downturns. This is because ROCE only looks at one year, instead of considering returns across a whole cycle. If Elecster Oyj is cyclical, it could make sense to check out this free graph of past earnings, revenue and cash flow.
Elecster Oyj's Current Liabilities And Their Impact On Its ROCE
Short term (or current) liabilities, are things like supplier invoices, overdrafts, or tax bills that need to be paid within 12 months. Due to the way ROCE is calculated, a high level of current liabilities makes a company look as though it has less capital employed, and thus can (sometimes unfairly) boost the ROCE. To counter this, investors can check if a company has high current liabilities relative to total assets.
Elecster Oyj has current liabilities of €11m and total assets of €50m. As a result, its current liabilities are equal to approximately 22% of its total assets. This very reasonable level of current liabilities would not boost the ROCE by much.
The Bottom Line On Elecster Oyj's ROCE
If Elecster Oyj continues to earn an uninspiring ROCE, there may be better places to invest. You might be able to find a better investment than Elecster Oyj. If you want a selection of possible winners, check out this free list of interesting companies that trade on a P/E below 20 (but have proven they can grow earnings).
If you are like me, then you will not want to miss this free list of growing companies that insiders are buying.
If you spot an error that warrants correction, please contact the editor at editorial-team@simplywallst.com. This article by Simply Wall St is general in nature. It does not constitute a recommendation to buy or sell any stock, and does not take account of your objectives, or your financial situation. Simply Wall St has no position in the stocks mentioned.
We aim to bring you long-term focused research analysis driven by fundamental data. Note that our analysis may not factor in the latest price-sensitive company announcements or qualitative material. Thank you for reading.

