
JD.com, Inc.'s (NASDAQ:JD) Stock Has Shown Weakness Lately But Financial Prospects Look Decent: Is The Market Wrong?
It is hard to get excited after looking at JD.com's (NASDAQ:JD) recent performance, when its stock has declined 17% over the past month. However, stock prices are usually driven by a company’s financials over the long term, which in this case look pretty respectable. Specifically, we decided to study JD.com's ROE in this article.
Return on Equity or ROE is a test of how effectively a company is growing its value and managing investors’ money. Simply put, it is used to assess the profitability of a company in relation to its equity capital.
View our latest analysis for JD.com
How Is ROE Calculated?
The formula for return on equity is:
Return on Equity = Net Profit (from continuing operations) ÷ Shareholders' Equity
So, based on the above formula, the ROE for JD.com is:
7.8% = CN¥22b ÷ CN¥287b (Based on the trailing twelve months to June 2023).
The 'return' refers to a company's earnings over the last year. That means that for every $1 worth of shareholders' equity, the company generated $0.08 in profit.
What Has ROE Got To Do With Earnings Growth?
Thus far, we have learned that ROE measures how efficiently a company is generating its profits. We now need to evaluate how much profit the company reinvests or "retains" for future growth which then gives us an idea about the growth potential of the company. Generally speaking, other things being equal, firms with a high return on equity and profit retention, have a higher growth rate than firms that don’t share these attributes.
JD.com's Earnings Growth And 7.8% ROE
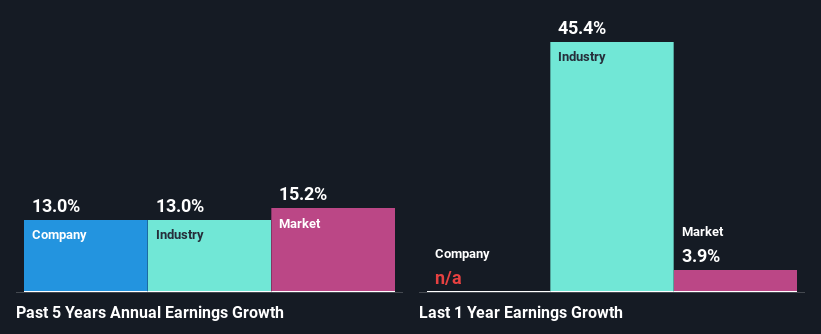
At first glance, JD.com's ROE doesn't look very promising. A quick further study shows that the company's ROE doesn't compare favorably to the industry average of 18% either. Although, we can see that JD.com saw a modest net income growth of 13% over the past five years. We reckon that there could be other factors at play here. Such as - high earnings retention or an efficient management in place.
We then performed a comparison between JD.com's net income growth with the industry, which revealed that the company's growth is similar to the average industry growth of 13% in the same 5-year period.
Earnings growth is a huge factor in stock valuation. It’s important for an investor to know whether the market has priced in the company's expected earnings growth (or decline). By doing so, they will have an idea if the stock is headed into clear blue waters or if swampy waters await. What is JD worth today? The intrinsic value infographic in our free research report helps visualize whether JD is currently mispriced by the market.
Is JD.com Making Efficient Use Of Its Profits?
JD.com has a healthy combination of a moderate three-year median payout ratio of 49% (or a retention ratio of 51%) and a respectable amount of growth in earnings as we saw above, meaning that the company has been making efficient use of its profits.
Conclusion
In total, it does look like JD.com has some positive aspects to its business. Despite its low rate of return, the fact that the company reinvests a very high portion of its profits into its business, no doubt contributed to its high earnings growth. Having said that, looking at the current analyst estimates, we found that the company's earnings are expected to gain momentum. To know more about the latest analysts predictions for the company, check out this visualization of analyst forecasts for the company.
Have feedback on this article? Concerned about the content? Get in touch with us directly. Alternatively, email editorial-team (at) simplywallst.com.
This article by Simply Wall St is general in nature. We provide commentary based on historical data and analyst forecasts only using an unbiased methodology and our articles are not intended to be financial advice. It does not constitute a recommendation to buy or sell any stock, and does not take account of your objectives, or your financial situation. We aim to bring you long-term focused analysis driven by fundamental data. Note that our analysis may not factor in the latest price-sensitive company announcements or qualitative material. Simply Wall St has no position in any stocks mentioned.

