
A Look At Fairfax Financial Holdings' (TSE:FFH) Share Price Returns

As an investor its worth striving to ensure your overall portfolio beats the market average. But its virtually certain that sometimes you will buy stocks that fall short of the market average returns. Unfortunately, that's been the case for longer term Fairfax Financial Holdings Limited (TSE:FFH) shareholders, since the share price is down 42% in the last three years, falling well short of the market decline of around 7.5%. And the ride hasn't got any smoother in recent times over the last year, with the price 30% lower in that time. It's down 6.4% in the last seven days.
Check out our latest analysis for Fairfax Financial Holdings
Given that Fairfax Financial Holdings didn't make a profit in the last twelve months, we'll focus on revenue growth to form a quick view of its business development. When a company doesn't make profits, we'd generally expect to see good revenue growth. That's because it's hard to be confident a company will be sustainable if revenue growth is negligible, and it never makes a profit.
In the last three years, Fairfax Financial Holdings saw its revenue grow by 15% per year, compound. That's a pretty good rate of top-line growth. Shareholders have seen the share price fall at 12% per year, for three years. So the market has definitely lost some love for the stock. With revenue growing at a solid clip, now might be the time to focus on the possibility that it will have a brighter future.
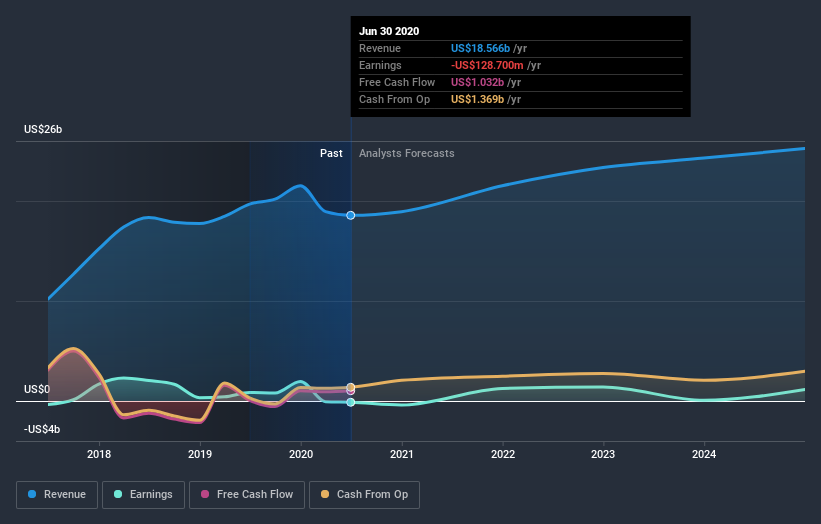
The company's revenue and earnings (over time) are depicted in the image below (click to see the exact numbers).
We consider it positive that insiders have made significant purchases in the last year. Even so, future earnings will be far more important to whether current shareholders make money. If you are thinking of buying or selling Fairfax Financial Holdings stock, you should check out this free report showing analyst profit forecasts.
What About Dividends?
It is important to consider the total shareholder return, as well as the share price return, for any given stock. The TSR is a return calculation that accounts for the value of cash dividends (assuming that any dividend received was reinvested) and the calculated value of any discounted capital raisings and spin-offs. Arguably, the TSR gives a more comprehensive picture of the return generated by a stock. In the case of Fairfax Financial Holdings, it has a TSR of -38% for the last 3 years. That exceeds its share price return that we previously mentioned. And there's no prize for guessing that the dividend payments largely explain the divergence!
A Different Perspective
We regret to report that Fairfax Financial Holdings shareholders are down 28% for the year (even including dividends). Unfortunately, that's worse than the broader market decline of 0.3%. However, it could simply be that the share price has been impacted by broader market jitters. It might be worth keeping an eye on the fundamentals, in case there's a good opportunity. Unfortunately, last year's performance may indicate unresolved challenges, given that it was worse than the annualised loss of 6% over the last half decade. We realise that Baron Rothschild has said investors should "buy when there is blood on the streets", but we caution that investors should first be sure they are buying a high quality business. It's always interesting to track share price performance over the longer term. But to understand Fairfax Financial Holdings better, we need to consider many other factors. Take risks, for example - Fairfax Financial Holdings has 2 warning signs (and 1 which shouldn't be ignored) we think you should know about.
If you like to buy stocks alongside management, then you might just love this free list of companies. (Hint: insiders have been buying them).
Please note, the market returns quoted in this article reflect the market weighted average returns of stocks that currently trade on CA exchanges.
This article by Simply Wall St is general in nature. It does not constitute a recommendation to buy or sell any stock, and does not take account of your objectives, or your financial situation. We aim to bring you long-term focused analysis driven by fundamental data. Note that our analysis may not factor in the latest price-sensitive company announcements or qualitative material. Simply Wall St has no position in any stocks mentioned.
Have feedback on this article? Concerned about the content? Get in touch with us directly. Alternatively, email editorial-team@simplywallst.com.

