
Is O2Micro International Limited's (NASDAQ:OIIM) Recent Stock Performance Influenced By Its Fundamentals In Any Way?

O2Micro International's (NASDAQ:OIIM) stock is up by a considerable 93% over the past three months. As most would know, fundamentals are what usually guide market price movements over the long-term, so we decided to look at the company's key financial indicators today to determine if they have any role to play in the recent price movement. Specifically, we decided to study O2Micro International's ROE in this article.
Return on Equity or ROE is a test of how effectively a company is growing its value and managing investors’ money. Put another way, it reveals the company's success at turning shareholder investments into profits.
See our latest analysis for O2Micro International
How To Calculate Return On Equity?
ROE can be calculated by using the formula:
Return on Equity = Net Profit (from continuing operations) ÷ Shareholders' Equity
So, based on the above formula, the ROE for O2Micro International is:
0.6% = US$427k ÷ US$74m (Based on the trailing twelve months to June 2020).
The 'return' is the income the business earned over the last year. One way to conceptualize this is that for each $1 of shareholders' capital it has, the company made $0.01 in profit.
Why Is ROE Important For Earnings Growth?
Thus far, we have learned that ROE measures how efficiently a company is generating its profits. We now need to evaluate how much profit the company reinvests or "retains" for future growth which then gives us an idea about the growth potential of the company. Assuming everything else remains unchanged, the higher the ROE and profit retention, the higher the growth rate of a company compared to companies that don't necessarily bear these characteristics.
O2Micro International's Earnings Growth And 0.6% ROE
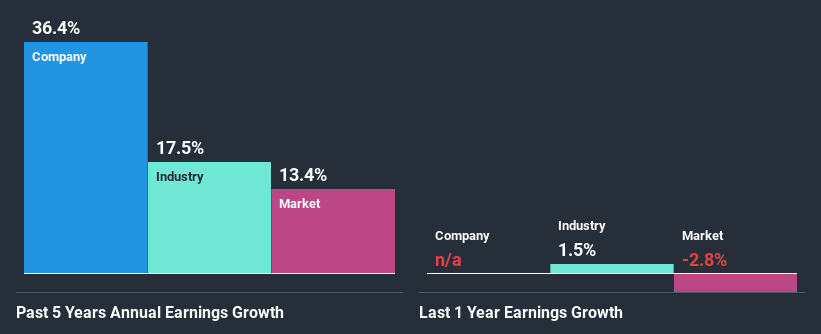
It is hard to argue that O2Micro International's ROE is much good in and of itself. Even when compared to the industry average of 11%, the ROE figure is pretty disappointing. Despite this, surprisingly, O2Micro International saw an exceptional 36% net income growth over the past five years. We reckon that there could be other factors at play here. For instance, the company has a low payout ratio or is being managed efficiently.
As a next step, we compared O2Micro International's net income growth with the industry, and pleasingly, we found that the growth seen by the company is higher than the average industry growth of 18%.
Earnings growth is an important metric to consider when valuing a stock. It’s important for an investor to know whether the market has priced in the company's expected earnings growth (or decline). This then helps them determine if the stock is placed for a bright or bleak future. One good indicator of expected earnings growth is the P/E ratio which determines the price the market is willing to pay for a stock based on its earnings prospects. So, you may want to check if O2Micro International is trading on a high P/E or a low P/E, relative to its industry.
Is O2Micro International Making Efficient Use Of Its Profits?
Given that O2Micro International doesn't pay any dividend to its shareholders, we infer that the company has been reinvesting all of its profits to grow its business.
Summary
On the whole, we do feel that O2Micro International has some positive attributes. Despite its low rate of return, the fact that the company reinvests a very high portion of its profits into its business, no doubt contributed to its high earnings growth. That being so, the latest analyst forecasts show that the company will continue to see an expansion in its earnings. To know more about the company's future earnings growth forecasts take a look at this free report on analyst forecasts for the company to find out more.
This article by Simply Wall St is general in nature. It does not constitute a recommendation to buy or sell any stock, and does not take account of your objectives, or your financial situation. We aim to bring you long-term focused analysis driven by fundamental data. Note that our analysis may not factor in the latest price-sensitive company announcements or qualitative material. Simply Wall St has no position in any stocks mentioned.
Have feedback on this article? Concerned about the content? Get in touch with us directly. Alternatively, email editorial-team@simplywallst.com.

