
Why We Like Haier Electronics Group Co., Ltd.’s (HKG:1169) 13% Return On Capital Employed

Today we'll evaluate Haier Electronics Group Co., Ltd. (HKG:1169) to determine whether it could have potential as an investment idea. To be precise, we'll consider its Return On Capital Employed (ROCE), as that will inform our view of the quality of the business.
First up, we'll look at what ROCE is and how we calculate it. Next, we'll compare it to others in its industry. Then we'll determine how its current liabilities are affecting its ROCE.
Return On Capital Employed (ROCE): What is it?
ROCE measures the amount of pre-tax profits a company can generate from the capital employed in its business. In general, businesses with a higher ROCE are usually better quality. Ultimately, it is a useful but imperfect metric. Author Edwin Whiting says to be careful when comparing the ROCE of different businesses, since 'No two businesses are exactly alike.
So, How Do We Calculate ROCE?
The formula for calculating the return on capital employed is:
Return on Capital Employed = Earnings Before Interest and Tax (EBIT) ÷ (Total Assets - Current Liabilities)
Or for Haier Electronics Group:
0.13 = CN¥3.8b ÷ (CN¥47b - CN¥18b) (Based on the trailing twelve months to June 2019.)
So, Haier Electronics Group has an ROCE of 13%.
View our latest analysis for Haier Electronics Group
Is Haier Electronics Group's ROCE Good?
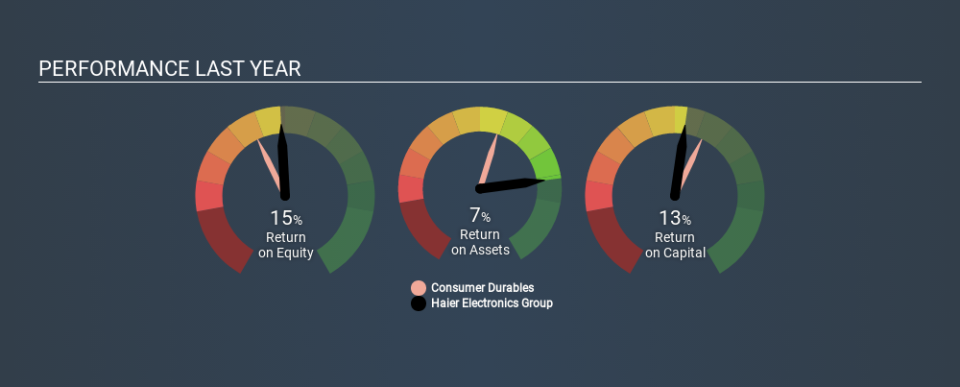
ROCE is commonly used for comparing the performance of similar businesses. Using our data, we find that Haier Electronics Group's ROCE is meaningfully better than the 10% average in the Consumer Durables industry. I think that's good to see, since it implies the company is better than other companies at making the most of its capital. Regardless of where Haier Electronics Group sits next to its industry, its ROCE in absolute terms appears satisfactory, and this company could be worth a closer look.
The image below shows how Haier Electronics Group's ROCE compares to its industry, and you can click it to see more detail on its past growth.
It is important to remember that ROCE shows past performance, and is not necessarily predictive. ROCE can be deceptive for cyclical businesses, as returns can look incredible in boom times, and terribly low in downturns. ROCE is, after all, simply a snap shot of a single year. What happens in the future is pretty important for investors, so we have prepared a free report on analyst forecasts for Haier Electronics Group.
Do Haier Electronics Group's Current Liabilities Skew Its ROCE?
Liabilities, such as supplier bills and bank overdrafts, are referred to as current liabilities if they need to be paid within 12 months. Due to the way ROCE is calculated, a high level of current liabilities makes a company look as though it has less capital employed, and thus can (sometimes unfairly) boost the ROCE. To check the impact of this, we calculate if a company has high current liabilities relative to its total assets.
Haier Electronics Group has total liabilities of CN¥18b and total assets of CN¥47b. As a result, its current liabilities are equal to approximately 38% of its total assets. With this level of current liabilities, Haier Electronics Group's ROCE is boosted somewhat.
What We Can Learn From Haier Electronics Group's ROCE
With a decent ROCE, the company could be interesting, but remember that the level of current liabilities make the ROCE look better. Haier Electronics Group shapes up well under this analysis, but it is far from the only business delivering excellent numbers . You might also want to check this free collection of companies delivering excellent earnings growth.
I will like Haier Electronics Group better if I see some big insider buys. While we wait, check out this free list of growing companies with considerable, recent, insider buying.
If you spot an error that warrants correction, please contact the editor at editorial-team@simplywallst.com. This article by Simply Wall St is general in nature. It does not constitute a recommendation to buy or sell any stock, and does not take account of your objectives, or your financial situation. Simply Wall St has no position in the stocks mentioned.
We aim to bring you long-term focused research analysis driven by fundamental data. Note that our analysis may not factor in the latest price-sensitive company announcements or qualitative material. Thank you for reading.

